
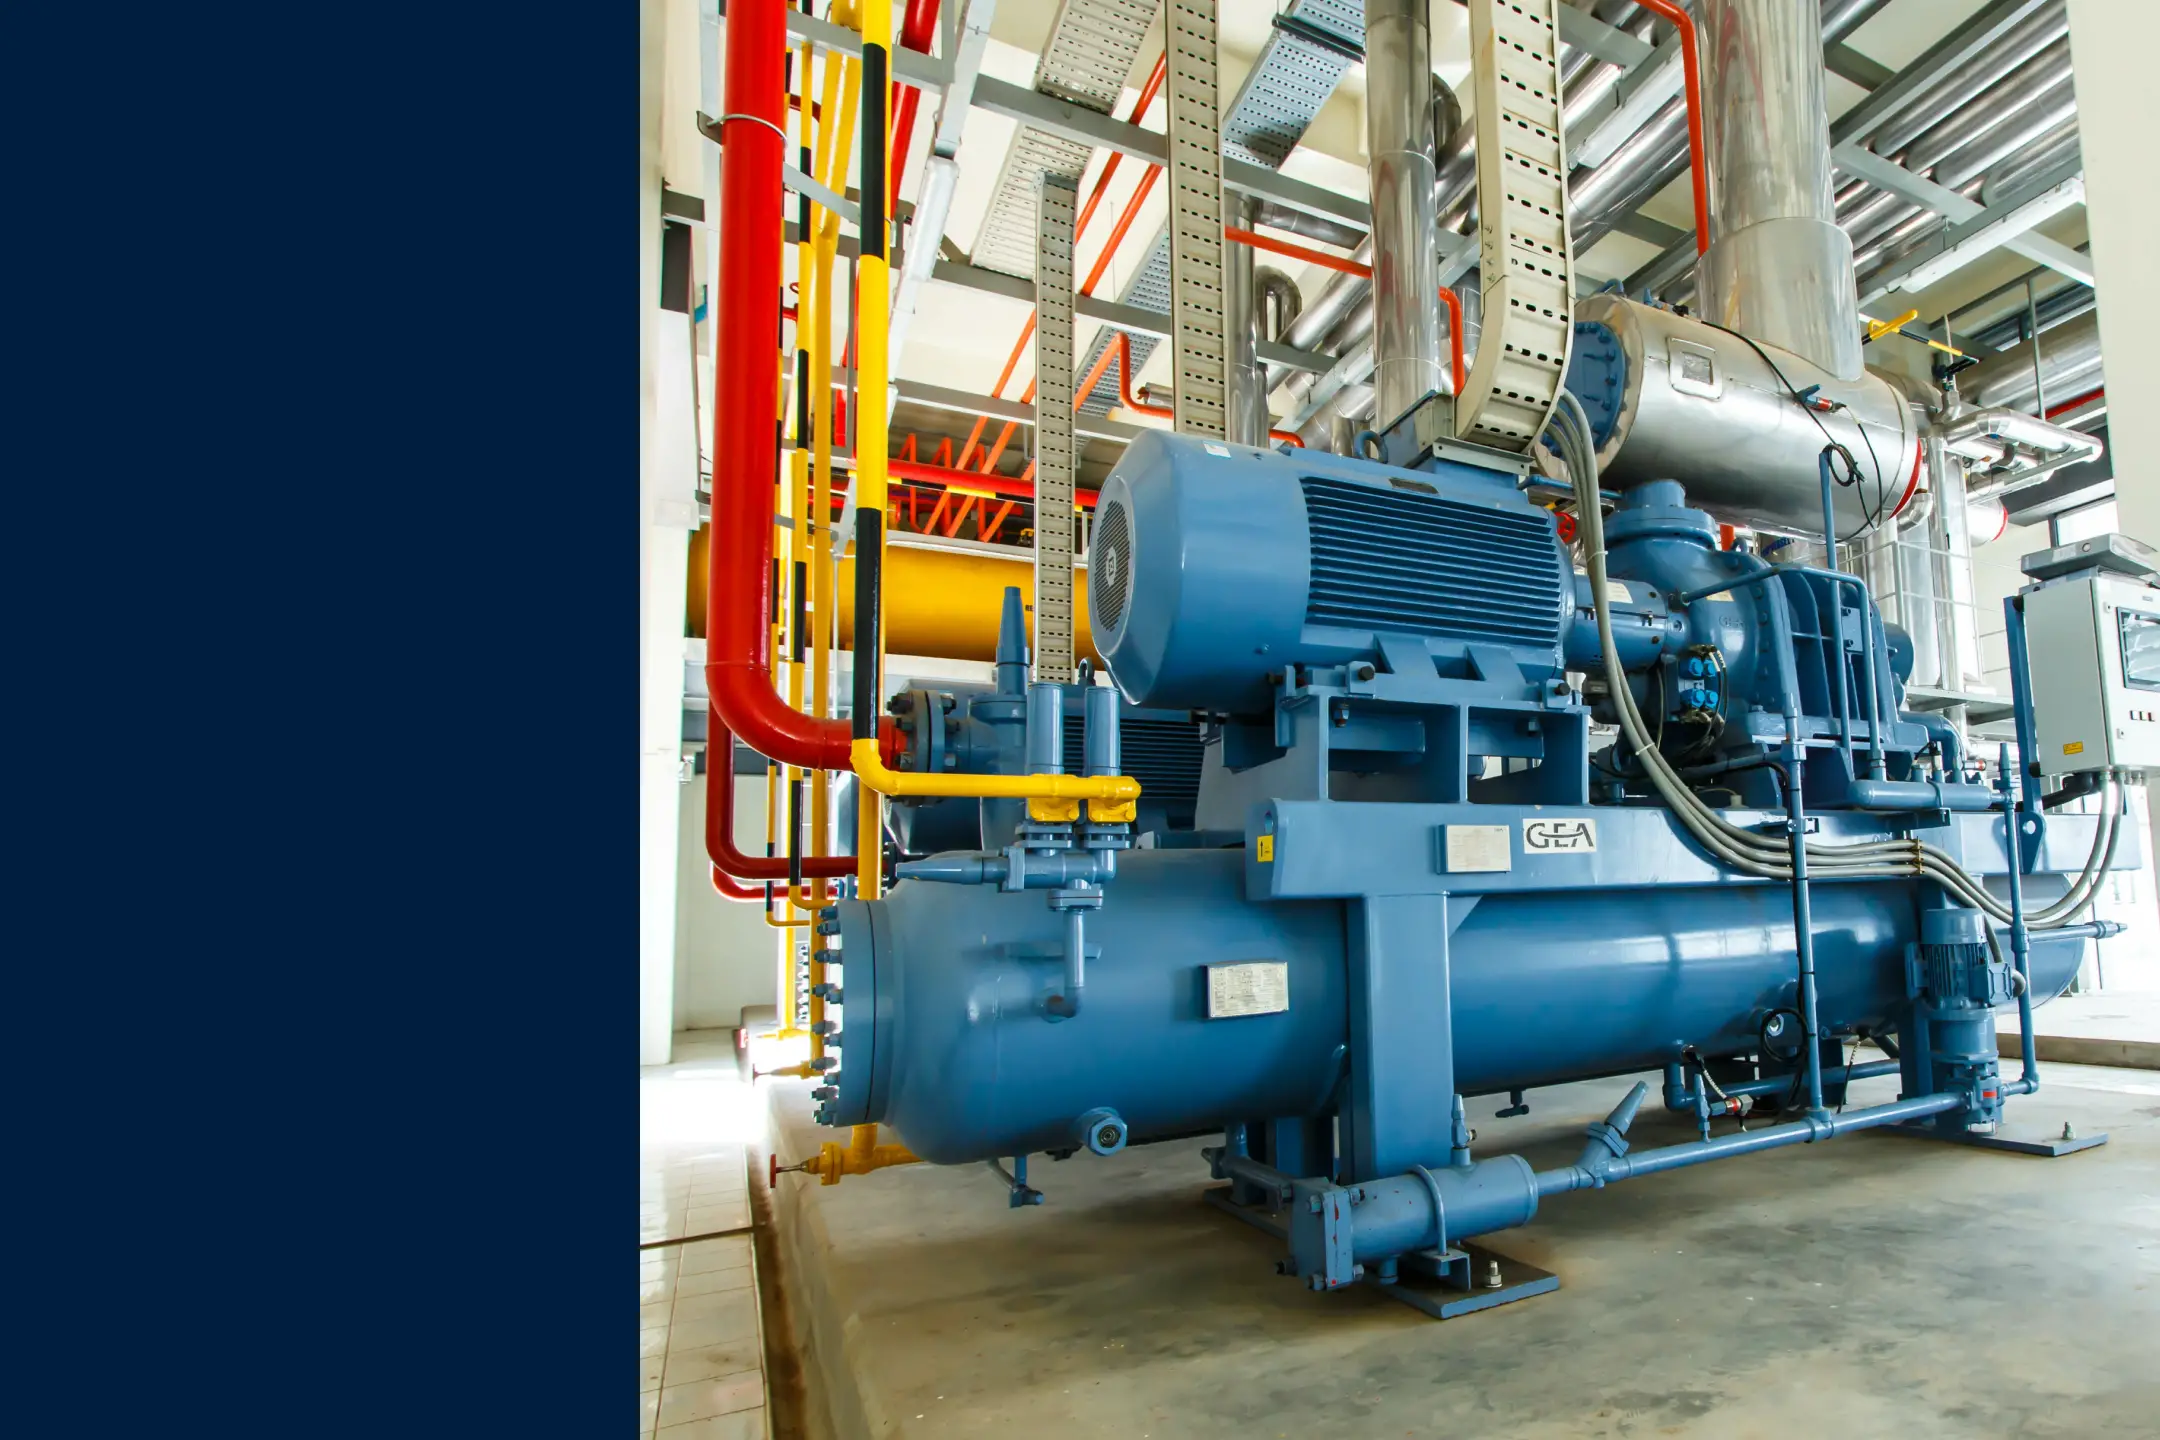
A packaging line conveyor motor and the break room printer can both fail. One stops production and creates a safety risk. The other means someone waits a few extra minutes for a document. Without a criticality assessment, both failures can end up competing for the same maintenance attention.
An asset criticality assessment scores every asset in your facility against the same consequence and likelihood factors, then ranks them so you can see, in order, which ones genuinely warrant a full failure analysis, which need a standard PM schedule, and which are fine to run until they fail.
The asset criticality template below is built to help you understand that ranking. You'll score each asset on consequence and likelihood, sort assets into High, Medium, and Low tiers, and map each tier to a next action so you’re left with a clear list of which assets deserve your team's time.
Key takeaways
- Score assets using consequence × likelihood, not an averaged 1–5 rating. Averaging lets everything cluster toward Medium or High; multiplying forces separation between your most and least critical equipment.
- Asset criticality and FMEA answer different questions. Criticality tells you which assets deserve attention; FMEA tells you how a specific asset can fail once you already know it's worth analyzing.
- A criticality score should point to the next action. High-criticality assets move to FMEA and condition monitoring, medium to scheduled PM, and low to run-to-fail.
What is an asset criticality assessment?
An asset criticality assessment is a scoring process that ranks your equipment by how much it would cost you if it failed. It’s measured through consequence (safety, production, quality, and repair/replacement cost) and likelihood (how often that type of failure happens).
This analysis gives you a consistent, repeatable way to rank hundreds or thousands of assets against each other. That way, decisions about where to put PM hours, spare parts budget, and condition monitoring aren't left to whoever's been at the facility the longest or whichever failure happened most recently.
Where an asset criticality assessment fits in your reliability program
Asset criticality assessments are often first in your reliability program. It's the triage step that you run across your entire asset list, before you commit time to any deeper analysis. Once you know which assets are high-criticality, you know what to focus on next.
That "what's next" is usually an FMEA. These two analyses often get confused because both involve scoring and feed into the same maintenance decisions, but they answer different questions:
- Criticality assessment: Which assets deserve serious attention? It scores assets, not failures, so you can see which equipment matters before looking at any specific way it might fail.
- FMEA: How could this asset fail, and how would we catch it? It scores failure modes, so it only makes sense once you know an asset matters and you're ready to dig into the specific ways it could fail and how likely each one is.
FMEAs take time to do well, so running one on every asset wastes effort on equipment that barely matters. A criticality assessment tells you which assets are worth that time.
For a full breakdown of how to run that failure-mode-level analysis once you've identified a high-criticality asset, see our guide to running an FMEA.
How to use this asset criticality assessment template
This template walks you through scoring your assets and turning that score into a clear next action. We'll use a packaging line conveyor motor as a running example so you can see how the numbers work at each step.
1. Fill in your assessment details and set up your asset list
Begin your assessment by establishing baselines that keep your criticality assessment in scope. To do this, record who's running the assessment and which assets you're including.
- Site: The facility or plant where the assets you're scoring are located
- Date: The date you're completing the assessment
- Completed by: The name of the person filling out the template
- Asset ID/Name: The specific asset being scored
- System/Sub-system: The line, system, or area the asset belongs to, so you can group and compare assets within the same operation
Include every asset in scope, not just the ones you assume are critical. You can't identify your true top 20% if the list is already filtered down to equipment you think matters. If you track assets in a CMMS, export the asset register for the area rather than building the list from memory, which tends to miss low-visibility equipment.
For example, if you're assessing Packaging Line B, your list would include Conveyor Motor #4 alongside every other asset on that line, from the case sealer and labeler down to smaller items like sensors and control panels. You'd fill in Site, Date, and Completed by once at the top, then list Conveyor Motor #4 under Asset ID/Name with "Packaging Line B / Conveyor system" as its System/Sub-system.
2. Score each asset and calculate a criticality score
To determine which assets are most critical, score each asset on the consequences of a failure and how likely that failure is. Then calculate its consequence total and criticality score. Here's what to consider for each field:
- Safety (1–5): How severe the safety or environmental impact would be if this asset failed, from 1 (no noticeable effect) to 5 (safety hazard, regulatory violation, or extended shutdown)
- Production (1–5): How much production or operational output this asset's failure would affect, from 1 (no noticeable effect on operation) to 5 (extended shutdown or major output loss)
- Quality (1–5): How much this asset's failure would affect product quality, from 1 (no noticeable effect on output quality) to 5 (widespread defects or product loss)
- Cost (1–5): How costly the repair or replacement would be if this asset failed, from 1 (negligible cost) to 5 (major repair or replacement cost)
- Likelihood (1–5): How often this asset actually fails, based on its history or industry norms for similar equipment, from 1 (rare) to 5 (frequent)
- Consequence total: The sum of the Safety, Production, Quality, and Cost scores for that asset
- Criticality score: The Consequence total multiplied by the Likelihood score
For example, if you were scoring the criticality of Conveyor Motor #4, you might rate Safety 3, Production 5, Quality 2, and Cost 4, for a Consequence total of 14. If the motor has failed three times in the past year, you'd score its Likelihood a 4. Multiplying 14 by 4 gives Conveyor Motor #4 a criticality score of 56. The break room printer, by contrast, might score 1 or 2 across every consequence category and a 1 for Likelihood, giving it a Consequence total of around 5 and a criticality score of 5.
3. Assign a criticality tier and map it to a next action
Next, convert each asset's criticality score into a tier (High, Medium, Low). The score tells you where an asset ranks; the tier definitions below translate that rank into what it actually means for how you maintain that asset.
- High covers failures that stop production or create a safety/environmental risk with no redundancy or workaround in place.
- Medium covers failures that limit production or require a workaround but don't halt operations entirely.
- Low covers failures with minimal or no impact on production, safety, or cost. These assets are acceptable to run to failure.
You will need to determine for yourself what thresholds constitute High, Medium, and Low. You should aim for your cutoff for High to include roughly the top 20% of your ranked list, then check that group against the tier definitions above. If an asset just inside that cutoff doesn't actually match what High describes, adjust the threshold rather than forcing it in because the number said so.
Any asset that scores a 5 on Safety should be reviewed for High regardless of its overall score. A failure that rarely happens can still be a serious one.
Once your criticality tiers are set, you need to assign the maintenance strategies that tier calls for under the “Recommended next action” column.
- High-criticality assets go to a full FMEA and condition monitoring.
- Medium-criticality assets go on a scheduled PM.
- Low-criticality assets are acceptable to run to failure.
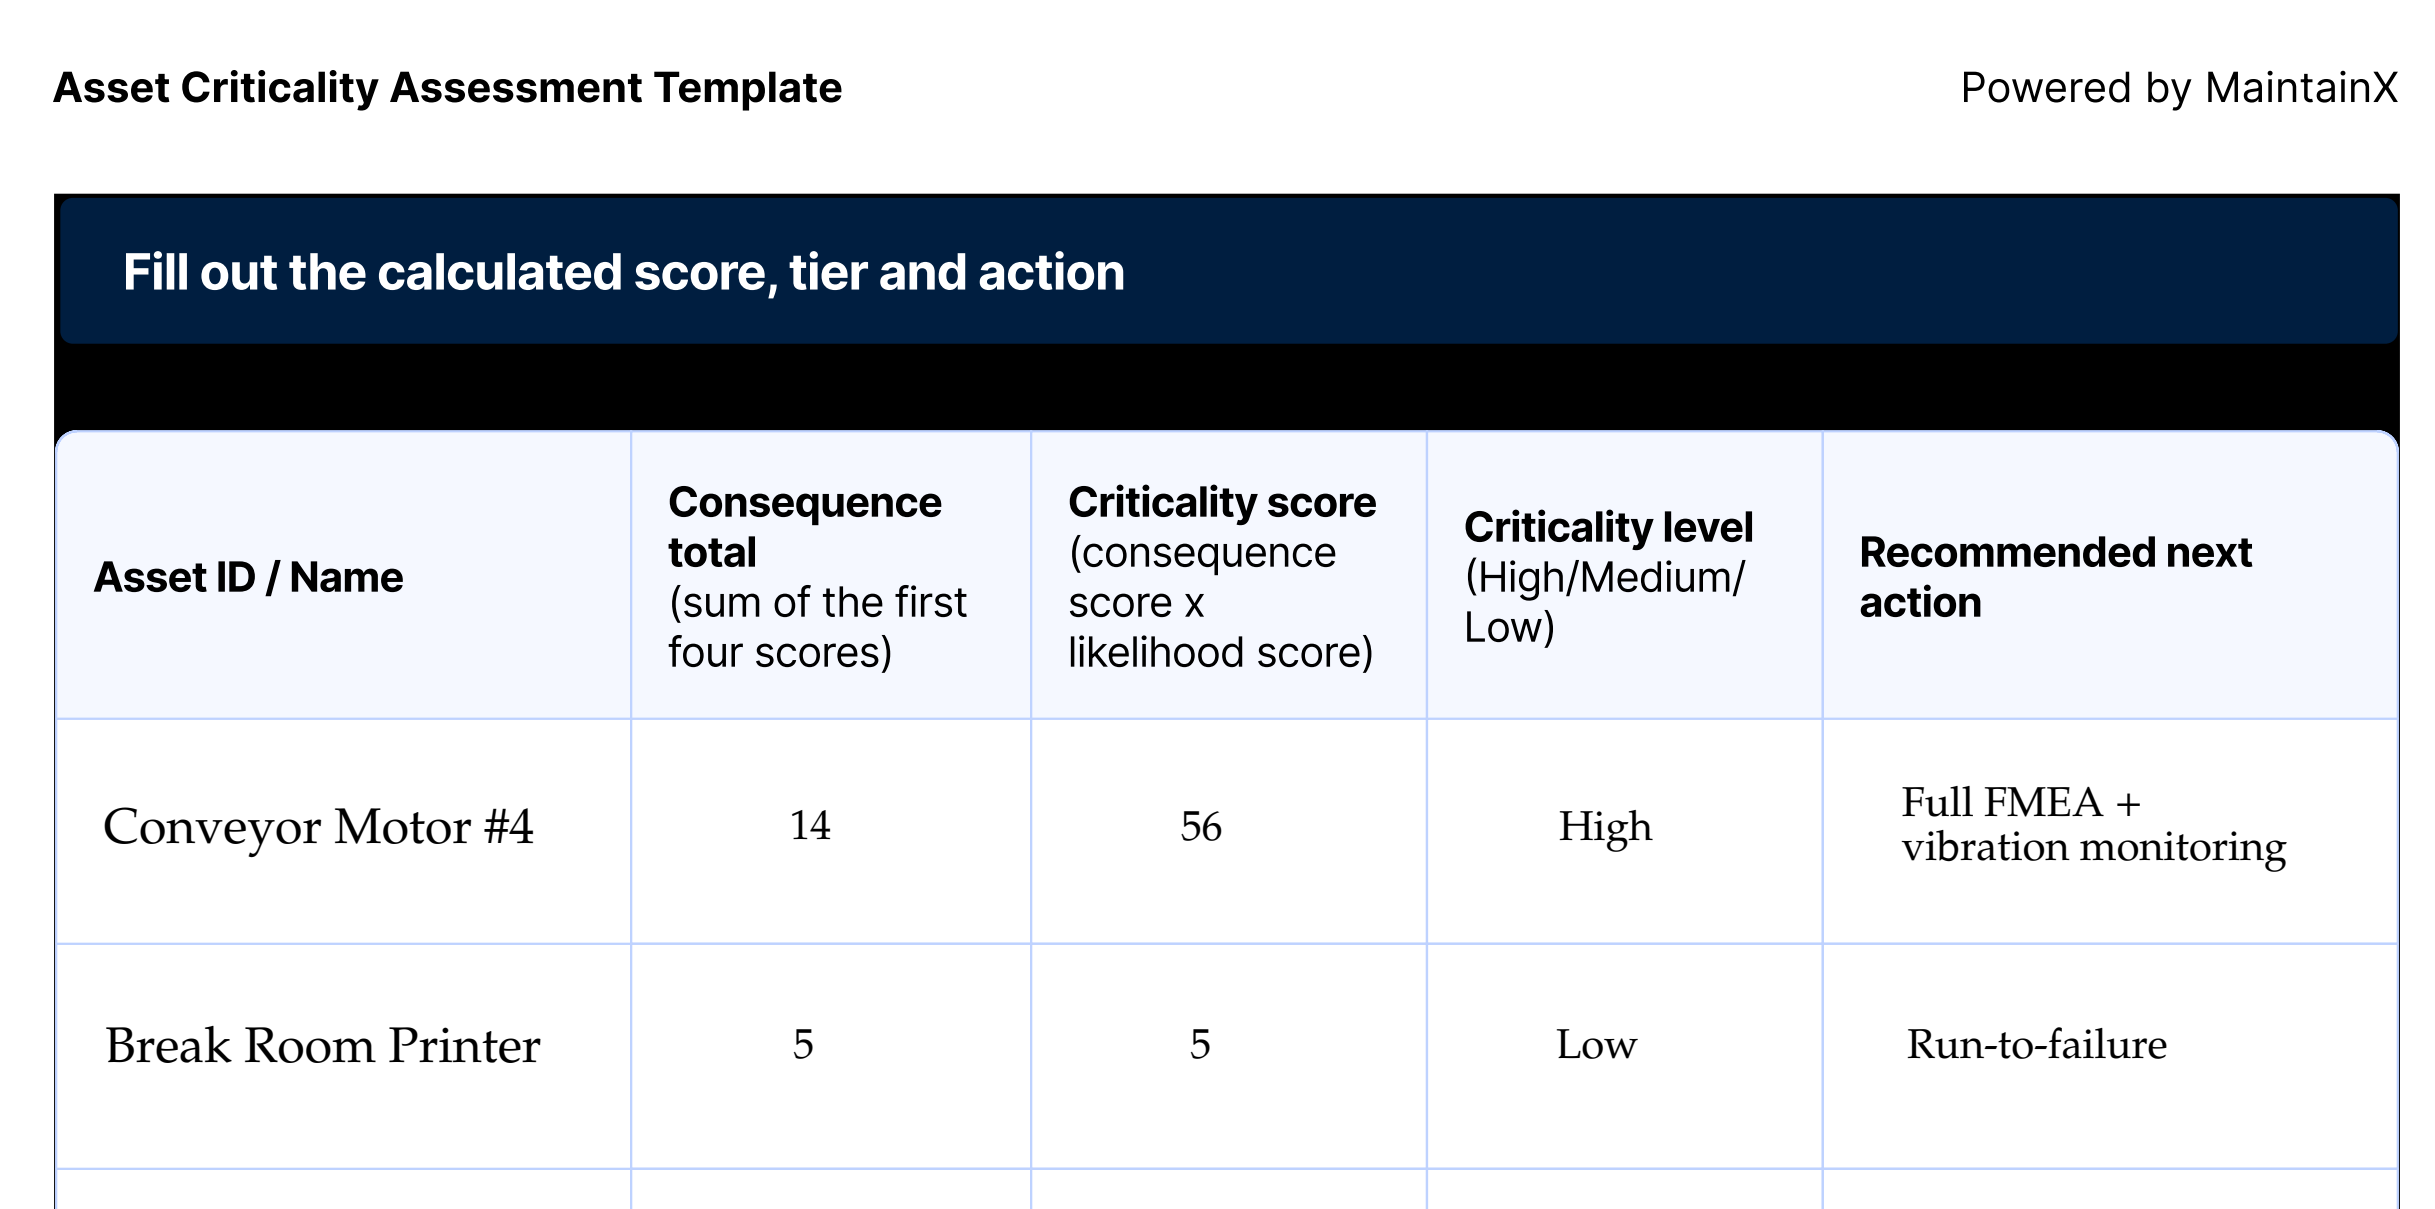
Conveyor Motor #4's score of 56 puts it at the top of Packaging Line B's ranked list. Checked against the definitions, it fits cleanly into High as it's line-stopping with no redundancy, so it gets routed to a full FMEA and flagged for vibration monitoring. The break room printer's score of 5 sits at the bottom and matches Low, so it stays on run-to-failure with no further action needed.
Common mistakes when scoring asset criticality
Most criticality assessments lose their value for the same handful of reasons:
- Letting too many assets land in "High." Teams tend to score generously, since no one wants to be the person who called a failed asset unimportant. Averaging makes it worse, because it squeezes scores into a narrow band where small differences decide the tier. Multiplying consequence by likelihood spreads the scores out so real differences show. If well over the 20% you're aiming for lands in "High," the scoring isn't differentiating anything.
- Scoring based on gut feel instead of data. A criticality score built on "this one feels important" instead of actual failure history, downtime cost, and safety records will drift toward whatever the loudest opinion in the room believes. Pull real numbers before you score, even rough ones.
- Treating the score as a one-time exercise. Equipment changes. A line gets reconfigured, a redundant system gets removed, a part starts failing more often than it used to. A criticality score from two years ago may no longer reflect what's running today.
- Confusing this with an FMEA and re-scoring failure modes instead of assets. If you catch yourself scoring "bearing wear" or "sensor drift" instead of "conveyor motor" or "control panel," you've drifted into FMEA territory. Finish the criticality assessment first, then run FMEA on the assets that earned it.
Most of these mistakes happen because teams treat the assessment as a one-time paperwork exercise instead of a decision-making tool. Get the scoring right, keep it current, and the ranking will tell you where to spend your team's maintenance time.
How a CMMS supports asset criticality assessment
A criticality score is only as good as the data behind it, and a spreadsheet can't pull that data on its own. A CMMS like MaintainX connects the assessment directly to the asset history it depends on, and to what happens after the scoring is done.
Instead of digging through spreadsheets and paper work orders to estimate failure frequency and repair cost, you can pull that history directly from the asset record, including downtime, past work orders, and maintenance costs. Once you've scored an asset, you can log its criticality tier directly on the asset itself, then filter and report on assets by tier. That makes it easy to pull up your full list of high-criticality assets when it's time to prioritize FMEA work, or confirm that your low-criticality assets aren't picking up PM hours they don't need.
Book a tour to see how MaintainX connects your asset criticality scores to PM schedules, work orders, and the asset history your FMEA depends on.
Asset criticality FAQs
What's the difference between asset criticality and FMEA?
Asset criticality scores assets to determine which ones deserve attention at all. FMEA scores the specific failure modes of an asset once you already know it's worth analyzing. Criticality assessment comes first and identifies your shortlist; FMEA goes deeper on the assets that make that list.
How often should you reassess asset criticality?
Most teams reassess annually, or sooner if something changes, like a line reconfiguration, a new asset coming online, or a shift in failure frequency for an existing one. A criticality score reflects current operating conditions, so it goes stale as those conditions change.
What factors should you include in a criticality score?
Most criticality scores combine consequence and likelihood. Consequence usually covers safety and environmental impact, production or operational impact, quality impact, and repair or replacement cost. Likelihood is based on how often the asset fails, drawn from asset history or industry norms for similar equipment. Regulated industries often add a regulatory or compliance impact category.
What software can help track asset criticality?
A CMMS like MaintainX centralizes the asset history, downtime, and cost data a criticality score depends on, and lets you tag assets as Critical, Important, or Normal so you can filter and report by tier. Spreadsheets work too, but the inputs go stale unless someone updates them by hand, and the score lives apart from your asset records and work orders.
How do you avoid rating everything as "high criticality"?
Multiply your consequence and likelihood scores instead of averaging them. Adding or averaging factors lets a high score in one area offset a low score in another, so most assets land in a narrow band. Multiplying spreads scores out, so an asset only reaches your top tier if it scores high on both consequence and likelihood. That gives you a genuine top 20% instead of a list where almost everything qualifies as important.

Marc Cousineau is the Senior Content Marketing Manager at MaintainX. Marc has over a decade of experience telling stories for technology brands, including more than five years writing about the maintenance and asset management industry.



.webp)