
Almost everything in maintenance comes back to two things: Safety and money.
Safety is an obvious one as it’s the number one job in any industrial company. But while there will always be some people who don’t agree, money is at the root of almost every other decision on the plant floor.
Reducing downtime is, ultimately, about the money you’ll lose if production isn’t running. Conversations about hiring staff and buying new technology always veer into how much budget you can get for these projects and how much of a return you can get on them. Every spare part you purchase and use amounts to millions of dollars worth of spend in the average manufacturing facility.
The problem for most maintenance teams isn’t that they’re spending too much money, it’s that they don’t know where the money is going in the first place or how much of it is going to those things.
That’s why this article explores maintenance costs: what they are, how to track them with work orders, and how to allocate budget effectively.
Key takeaways
- Work orders give maintenance teams a practical way to track the direct cost of maintenance work by tying labor hours, parts usage, and downtime to specific jobs and assets.
- Once cost data is attached to work orders, teams can compare preventive and reactive maintenance, identify high-cost assets, spot repeat failures, and improve labor and inventory planning.
- Better cost tracking also helps maintenance leaders communicate in business terms by showing how maintenance affects uptime, capacity, and cost control.
Types of maintenance costs
If you want to understand where money is going and where better decisions can reduce maintenance costs without increasing risk, it helps to break maintenance spend into these categories:
Labor
What it is: Labor costs include the wages and time associated with technicians, operators, supervisors, planners, and third-party contractors involved in maintenance work.
Why track it: Tracking labor costs helps teams understand where maintenance time is being spent and identify opportunities to improve efficiency, staffing, and planning.
How to track it: Labor costs can be tracked by multiplying each employee’s hourly rate by the amount of time they worked, then adding up these totals.
Example: Let’s say you want to know how much spent on labor for reactive maintenance in a given month. The average hourly rate of your technicians is $50 and the team spent 40 hours on reactive maintenance. That means that the total labor cost would be $2,000.
Parts and materials
What it is: Parts and materials costs include spare parts, replacement components, consumables, lubricants, fasteners, tools, and PPE used to complete maintenance work.
Why track it: Tracking these costs helps control inventory spending, reduce waste, and ensure critical parts are available when needed.
How to track it: Parts and materials costs are tracked differently based on the item being used. Spare parts, like a filter, may be more straightforward as you would multiply the number of filters used by the cost of each filter. However, for consumables, like lubricant, you may track it by the cost of each bottle, instead of the amount for each job.
Example: You may want to calculate the cost of parts and materials on a given asset in a quarter. You would multiply the cost of each part and material used by the number of each that was used. So you might have used two conveyor roller bearings ($22 each), one replacement V-belt ($17 each), three cans of lubricant ($20 each), and one box of nitrile gloves ($15 each). Therefore, the cost of parts and materials for this asset would be $96.
Utilities
What it is: Utilities costs include the electricity, water, gas, and other resources required to operate and maintain equipment and facilities.
Why track it: Tracking utility costs helps uncover inefficient assets, measure the impact of maintenance on energy performance, and reduce avoidable operating expenses.
How to track it: Utilities can be tracked through meter readings, utility bills, and equipment-level monitoring tied back to assets or production areas.
Example: If you want to find the electricity costs for running a conveyor in a given month, you would look at how much energy is used (15 kW per hour and it ran for 120 hours, equalling 1,800 kW) and the per kWh rate of electricity ($0.12). When you multiply those numbers (1,800 and $0.12) you’d arrive at a cost of $216.
Downtime
What it is: Downtime costs include the financial impact of planned shutdowns as well as unplanned equipment failures that disrupt production or operations.
Why track it: Tracking downtime costs helps teams quantify the true business impact of maintenance issues and prioritize work that improves reliability and uptime.
How to track it: Downtime costs can be tracked by adding up three separate components: labor, parts, and lost production.
Example: Let’s say you’re calculating the cost of a single unplanned downtime event on one asset. Your technician is paid $50 an hour and spent three hours on the repair. The parts used to complete the repair cost $3,500 because of rush shipping. The per-unit cost of the products produced on that machine is $1 and the per hour rate of production is 1,000 units. Because the line was down for three hours, the production loss was $3,000. So the total cost of downtime is: $150 + $3,500 + $3,000 for a total of $6,750.

79% of teams saw the amount of unplanned downtime stay the same or increase over the past year, and 39% say the cost of downtime is rising.
Training and professional development
What it is: Training and professional development costs include onboarding, certifications, technical training, safety education, and ongoing skill development for maintenance teams.
Why track it: Tracking training costs helps justify workforce investment and shows how skill development supports safer work, better performance, and fewer errors.
How to track it: These costs can be tracked through course fees, certification expenses, paid training hours, and internal training program costs.
Example: There might be a set of new safety protocols that you need to train your team on. You bring in an expert to train the team, which costs $5,000. The training takes two hours and the average hourly salary of your 10 technicians is $50, equalling $1,000 in labor hours. The total cost of that training would be $6,000
Technology
What it is: Technology costs include software, sensors, monitoring tools, mobile devices, automation systems, and other digital solutions that support maintenance operations.
Why track it: Tracking technology costs helps teams evaluate ROI, manage software and hardware spend, and understand which tools are driving better maintenance outcomes.
How to track it: Technology costs can be tracked by monitoring subscription fees, implementation costs, support expenses, and usage by site, team, or function.
Example: If you want to calculate the annual cost of your computerized maintenance management system (CMMS), you might look at the number of users you pay for (let’s say 10) and the cost per user, per month (100/month, so $1,200/year). That means that the cost of maintenance software would be $12,000 a year.


How to track maintenance costs with work orders
Tracking how much you spend on each maintenance task allows you to see trends and more easily spot areas in which you can reduce costs or reallocate resources to improve maintenance. This is especially powerful when you combine cost tracking with work order tagging so you can segment work orders to understand how much you spend on certain tasks. For example, you can identify which assets cost the most or compare the cost of preventive and reactive maintenance.
Not every maintenance cost can be tracked work orders, so let’s dive into which ones you can measure and how.
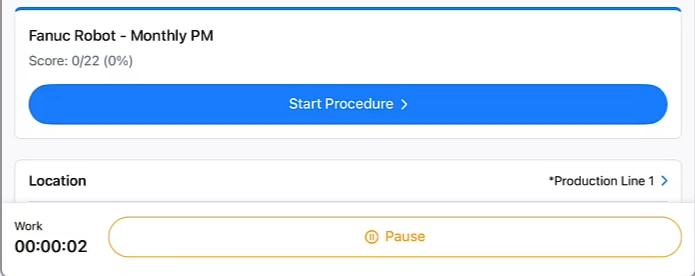
Step 1: Track time spent on work orders
Record the time each technician spends on a work order. This can be done two ways:
- The technician(s) can add the total number of hours worked on the job (to the quarter hour) at the conclusion of the task
- If you have maintenance software that has a timer function, the technician(s) can start the timer at the beginning of the work order, pause it when necessary, and stop the timer when the job is completed
Make sure there is an area on a work order where technicians can add the time they spent on the job. Accurate time tracking gives you the foundation for understanding labor costs.
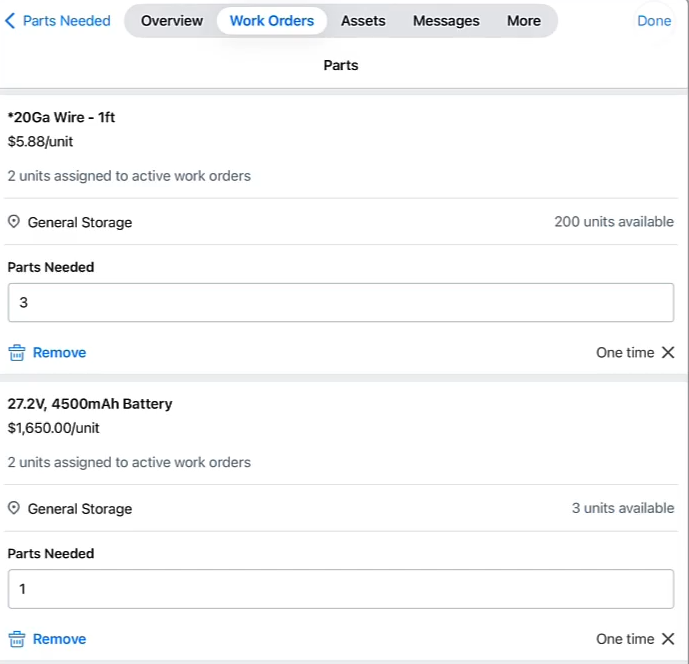
Step 2: Track parts usage
Log every part and material used to complete the job, including spares, consumables, and PPE. Include a section on the work order where technicians need to log any part or material used. With some maintenance software, you can set up inventory capabilities to automatically sum up the cost of parts when they are added to a work order.
This creates a clear record of inventory usage and helps connect material spend directly to specific maintenance activities.
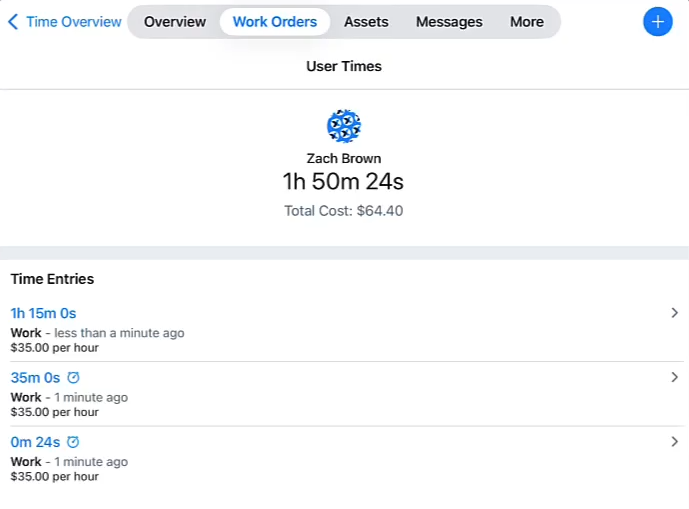
Step 3: Calculate total labor costs
Multiply the hours logged on the work order by each employee’s hourly labor rate, including contractors if needed. This shows the true labor cost of completing the job and makes workforce spending easier to analyze.
Step 4: Calculate total parts inventory costs
Add up the cost of every part and material charged to the work order based on inventory value or purchase price. This gives you a complete view of the direct material cost tied to the repair or task.
Step 5: Add the cost of downtime (if applicable)
If the work caused or responded to downtime, calculate the cost of lost production, delayed output, or idle labor during that period. Including downtime helps capture the full business impact of the maintenance event.
Step 6: Determine the final cost of a work order
Add labor costs, parts costs, and any downtime costs to find the total cost of the work order. This final number helps teams understand maintenance spend, identify trends, and make better planning decisions.
How to use the data to reduce maintenance costs
The real value of tracking maintenance costs comes from using that data to make better decisions. A cost report on its own will not lower spend. What it can do is show you where money is being lost, which assets are driving unnecessary spending, and where changes in planning, inventory, or maintenance strategy can improve the bottom line without increasing risk.
Here are a few practical ways to use maintenance cost data once it is tied to work orders.
Identify your most expensive assets
One of the fastest ways to find savings is to look at which assets generate the highest maintenance costs over time. This helps you answer questions like:
- Which assets are consuming the most maintenance budget?
- Are those costs driven by frequent minor repairs or a few major failures?
- Is it cheaper to keep repairing the asset, or is it time to replace it?
When costs are tied to specific assets, you can move beyond guesswork and make repair-or-replace decisions with more confidence.
Compare reactive and preventive maintenance costs
Many teams know reactive maintenance is expensive. Fewer can show exactly how expensive it is.
When work orders are tagged by maintenance type, you can compare the labor, parts, and downtime associated with reactive work versus preventive work. That makes it easier to quantify the cost of firefighting and build a stronger case for things like PM optimization or condition monitoring.
For example, if reactive work consistently requires more overtime, rush shipping, and downtime than planned work, it’s a clear sign that reducing reactive maintenance should be a priority.
Find repeat problems that keep draining budget
Some of the biggest maintenance costs come from the same issue happening over and over again.
Use work order data to spot repeat failures by asset, component, or failure type. If you see the same conveyor bearing, motor, or pump seal showing up again and again, the problem may not be the repair itself. It may be weak PM tasks, bad operating conditions, or an underlying design issue.
Fixing one recurring problem can remove a surprising amount of labor, parts spend, and downtime from the budget.
Improve labor planning
When labor hours are captured consistently on work orders, you can see whether time is going to planned work, reactive work, emergency response, inspections, shutdowns, or follow-up repairs. That helps you identify where the team is losing efficiency.
For example, you may find that technicians are spending too much time on emergency work, waiting for parts, or repeating low-value PMs. Those insights can help you rebalance schedules, improve planning, and make better use of existing labor before adding headcount.
Reduce parts and inventory waste
Parts data tied to work orders can show how inventory decisions are affecting maintenance costs.
If certain parts are being used far more often than expected, that may point to recurring equipment issues or poor PM effectiveness. If repairs regularly require rush orders, that may indicate weak stocking strategy for critical spares. If expensive parts are being consumed on low-priority assets, that may signal a budget allocation problem.
In other words, better parts data helps you control spend without blindly cutting inventory.
Prioritize the work with the biggest business impact
Not all maintenance work carries the same financial consequence. Some work orders affect an asset with little operational impact. Others affect production lines where every minute of downtime is expensive.
When you combine work order costs with downtime and asset criticality, you can prioritize work based on business impact, not just urgency. That helps maintenance managers focus limited labor where it protects the most uptime, capacity, and cost.
This also helps plant managers see maintenance in business terms. Instead of looking at maintenance as a cost center, they can see which work protects production and which failures are creating the biggest financial drag.
Build a stronger case for budget and process changes
Good maintenance data allows you to justify future investments.
When you can show that a group of assets is driving excessive downtime cost, or that reactive work is consuming a disproportionate amount of labor and parts, it becomes much easier to make the case for additional staffing, critical spares, training, contractor support, or new technology.
That is a much stronger position than saying costs feel high. You are showing where money is being lost, why it is happening, and what change is likely to improve the result.


Turn maintenance cost data into better decisions
Tracking maintenance costs is about understanding which assets, failures, and work types are driving the most cost and where changes can improve performance. When work orders capture labor, parts, and downtime consistently, teams can make smarter decisions about planning, inventory, and maintenance strategy. That leads to better cost control, stronger reliability, and a clearer connection between maintenance work and business results.

Marc Cousineau is the Senior Content Marketing Manager at MaintainX. Marc has over a decade of experience telling stories for technology brands, including more than five years writing about the maintenance and asset management industry.


.webp)