

Most multi-site maintenance teams already have dashboards, spreadsheets, monthly reviews, and other reporting basics. On paper (or a screen), the data is there.
But despite all this information, it doesn’t answer the most pressing questions, like why downtime is increasing at one site, or where costs are going up, and what actions should happen next.
That’s because different sites track different metrics, or even the same metrics in different ways. Work orders are captured differently. Failure codes mean different things from plant to plant. Instead of creating clarity, reporting creates debate.
Strong multi-site maintenance reporting is about creating a decision infrastructure. That includes building a system leaders can use to compare sites fairly, understand what is happening across the network, and make better decisions about where to spend time, money, and attention.
This guide shows how to build that system in a practical way. You’ll learn how to standardize the basics, which metrics are worth tracking across sites, how to analyze the data, and how to turn reporting into real decisions.
Key takeaways
- Multi-site maintenance reporting only works when teams standardize KPI definitions, data capture, and site-level reporting, so leaders can compare performance using trusted data.
- The most useful metrics are the ones that help you understand downtime, PM compliance, MTTR, cost, and parts usage so you can spot trends, compare sites, and decide where to act.
- Good reporting should surface the right questions, reveal what top sites are doing differently, and trigger clear decisions and follow-up actions across the network.
Why multi-site maintenance reporting is important
Single-site reporting helps you understand what happened. Multi-site reporting helps you decide what to do next.
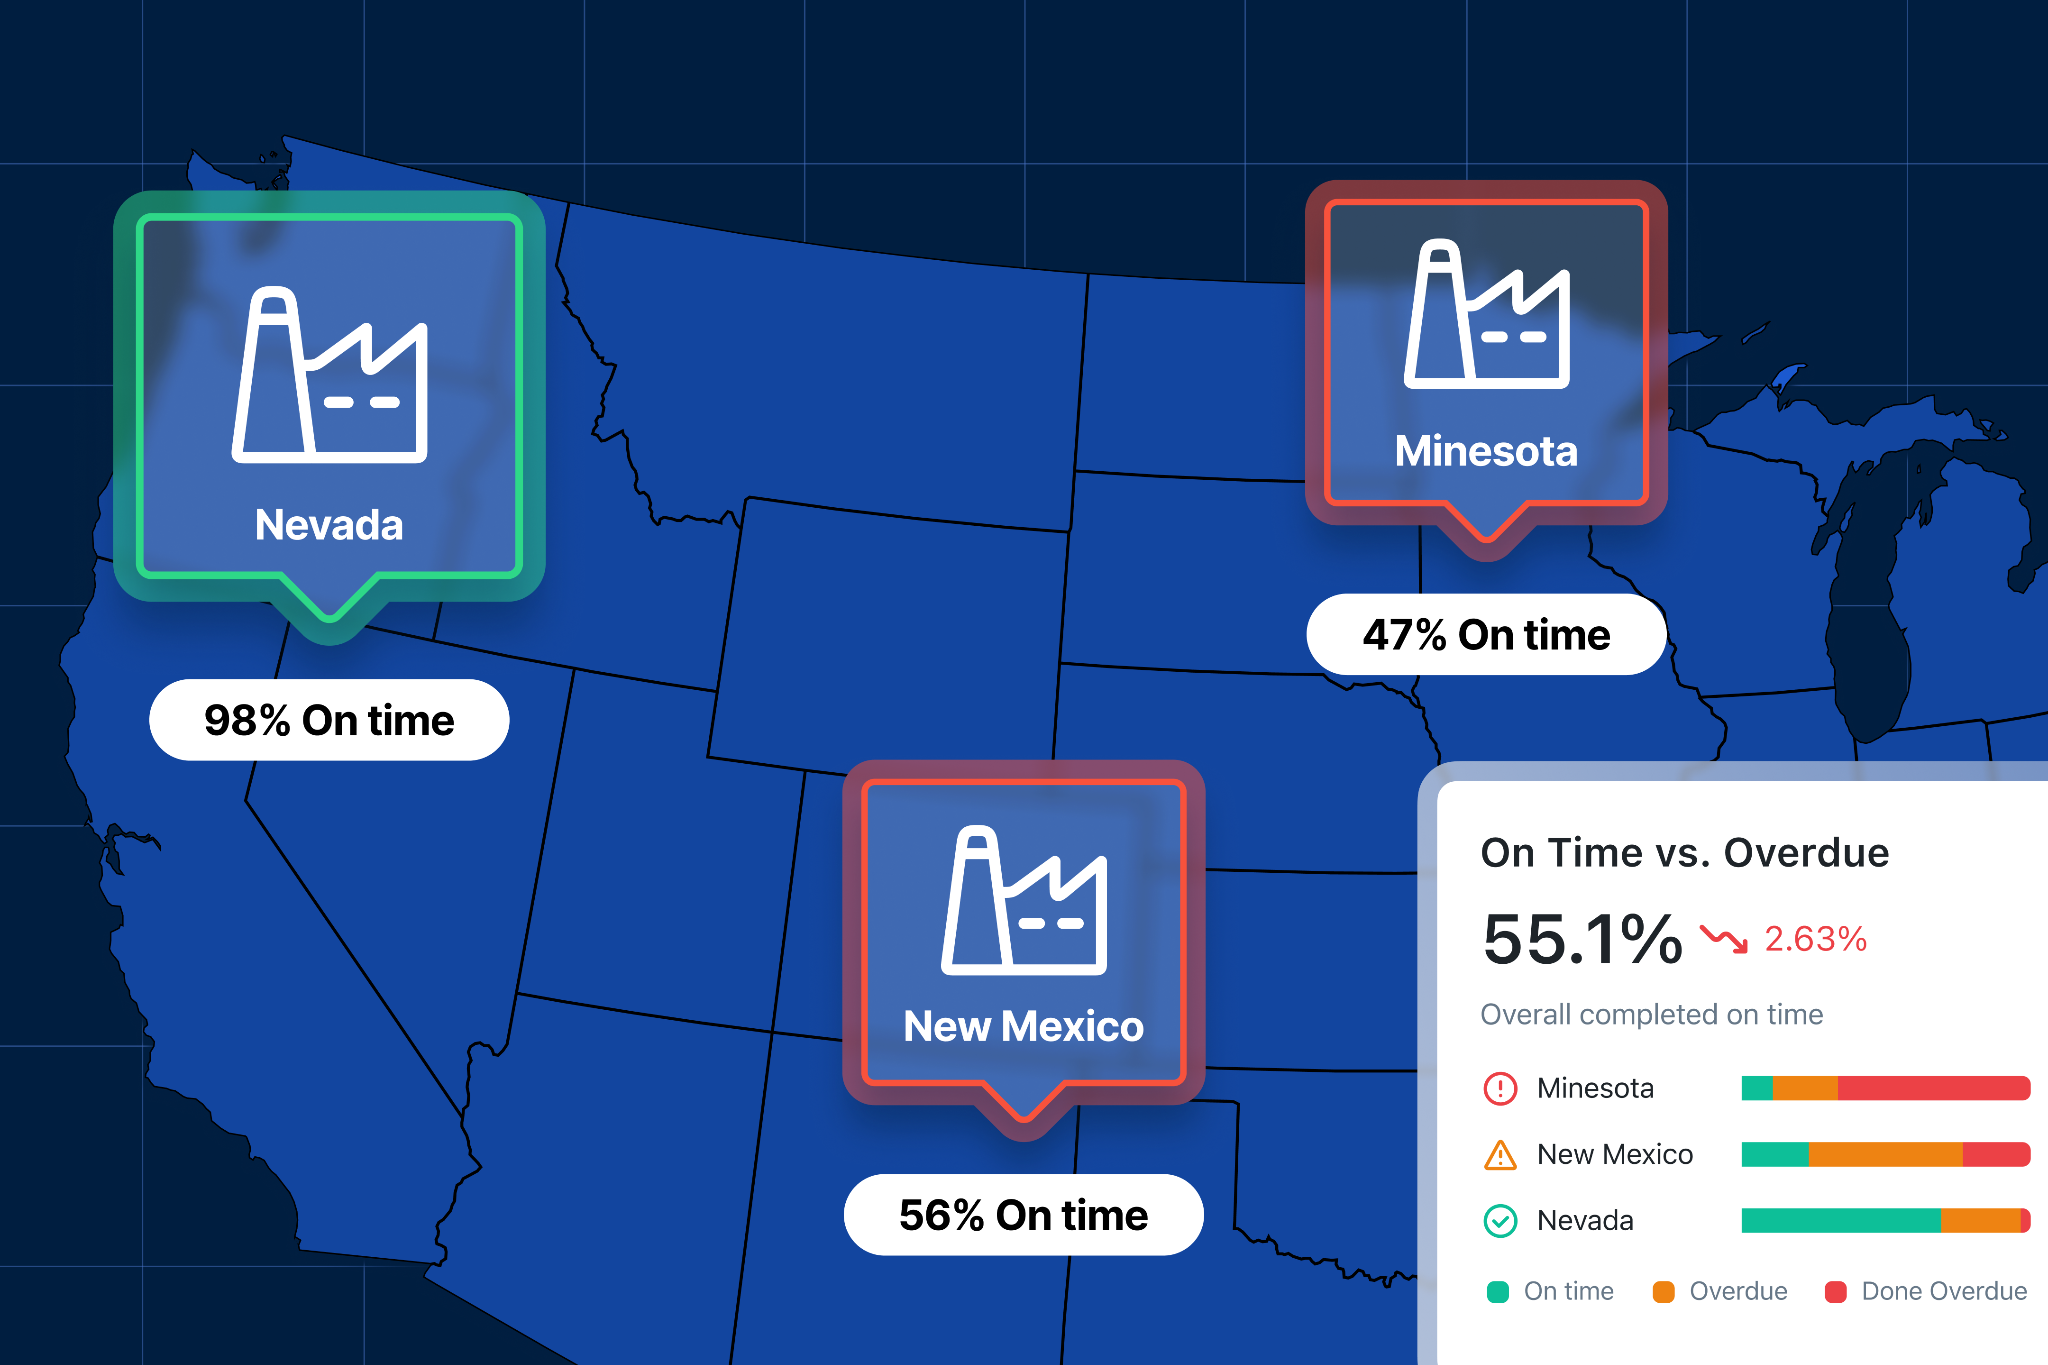
Once you are responsible for more than one plant, the goal is to track variation in maintenance performance across sites and what it means. One site may be running more smoothly, have higher costs, or be seeing more downtime but higher output. Without a consistent reporting framework, those differences are easy to misread or miss entirely.
Standardizing maintenance data and processes across sites
If every site defines metrics differently, reporting becomes confusing very quickly. For example, one site may tag a short stoppage as downtime while another might ignore anything under 15 minutes. The numbers may look similar, but they are not measuring the same thing. You think you’re comparing sites, but you’re really comparing methods.
Standardization fixes that. It creates one shared language for maintenance reporting across the network. That doesn’t mean every site has to operate identically. It means the core definitions need to be consistent enough that leaders can trust the output.
That consistency also carries through to daily maintenance activities and processes. When the numbers can be interpreted reliably, it’s easy to see where sites are operating differently so you can better align them around best practices.
Visibility: seeing the business across the network
Multi-site maintenance leaders need to understand how performance is trending across the entire operation. That requires a reporting structure that shows insights like where downtime is concentrated, which sites are improving, and where maintenance costs are drifting before it turns into a larger problem. This helps you react to the most important issues instead of the loudest ones.
Good reporting also tells you how to solve these problems by highlighting which facilities are doing it the best. For example, it can surface whether one plant is improving because of a new process or new technology. Those patterns are hard to see when data lives in silos.
That matters because multi-site maintenance is more of an enterprise performance issue than a collection of isolated plant problems. The team that can see across sites can allocate resources better, prioritize improvements, and avoid making decisions based on incomplete information.
Executive trust: turning maintenance into something the business can use
Maintenance teams often know the work is important. The harder part is showing why it matters in terms the rest of the business will trust. That is where reporting comes in.
When reporting is inconsistent or incomplete, maintenance can look like a collection of tasks instead of a driver of uptime, cost control, and production performance. Leaders may still support the function, but they are less likely to see it as a strategic lever. And when that happens, it becomes harder to secure budget, justify headcount, or explain why one site needs more support.
Strong reporting gives you a credible way to connect maintenance activity to business outcomes, like where downtime is affecting capacity. When the data is trusted, maintenance stops being a black box and instead builds executive confidence in the function.
Five steps for setting up multi-site maintenance reporting
These are the five steps to follow to create maintenance reporting that actually works across multiple sites and leads to action.
1. Standardize KPIs
Before you look at a single dashboard, you need to agree on what your numbers actually mean. Without this as your first step, all the data that comes after is less trustworthy. For example, two plants might report:
- 90% PM compliance
- Similar downtime levels
- Comparable maintenance costs
But when you look deeper, you see one site counts a PM as complete when it’s started and another when it’s fully closed. One site logs minor stoppages as downtime and the other ignores anything under 10 minutes. One includes contractor labor in maintenance costs and the other doesn’t.
Each approach might make sense for individual facilities, but it makes the data unreliable in a multi-site analysis. Aligning on which KPIs to measure and how to measure them is crucial. In this scenario, that might look like defining:
- What counts as downtime
- How planned vs. unplanned work is classified
- How compliance is calculated
- What gets included in cost
2. Standardize data capture
Reporting only works if the data is captured consistently in day-to-day work. This is where strategy meets execution. Most maintenance data comes from technicians and the information they log throughout the day as they do work. If the processes and structure around that work is different from site to site, the data will almost certainly be inconsistent, incomplete, and unreliable.
For example, if one site only uses two tags to categorize work orders (like preventive and corrective) while another site uses a second, more detailed layer of tags (like preventive-safety or corrective-alignment), you won’t be able to compare the sites properly.
Fixing this requires designing data capture into the workflow. That typically means:
- Defining required fields in work orders
- Using structured fields instead of free text where possible
- sStandardizing asset hierarchies and naming conventions
- Simplifying how technicians log failure causes and work performed
These workflows need to be naturally integrated into the routines that technicians already have. If data capture slows technicians down or feels disconnected from the work, adoption drops. And when adoption drops, reporting quality follows.
3. Stabilize site-level reporting first
Each facility needs to trust its own data before you compare sites. Without stable site-level reporting, cross-site comparisons create more confusion than clarity. At this stage, the goal is simple: make reporting useful locally. Each plant should be able to:
- Set benchmarks for KPIs
- Track its core metrics reliably
- Understand what’s driving performance week to week
- Use reporting to make basic operational decisions
If a site sees its PM compliance fluctuate wildly for no clear reason, or if downtime reporting doesn’t match what the team experienced on the floor, it’s a signal to reevaluate the reporting process.
This is why stabilization matters—it allows you to validate that the reporting reflects reality closely enough to guide action. If a site doesn’t trust its own reporting, it won’t trust cross-site reporting either.
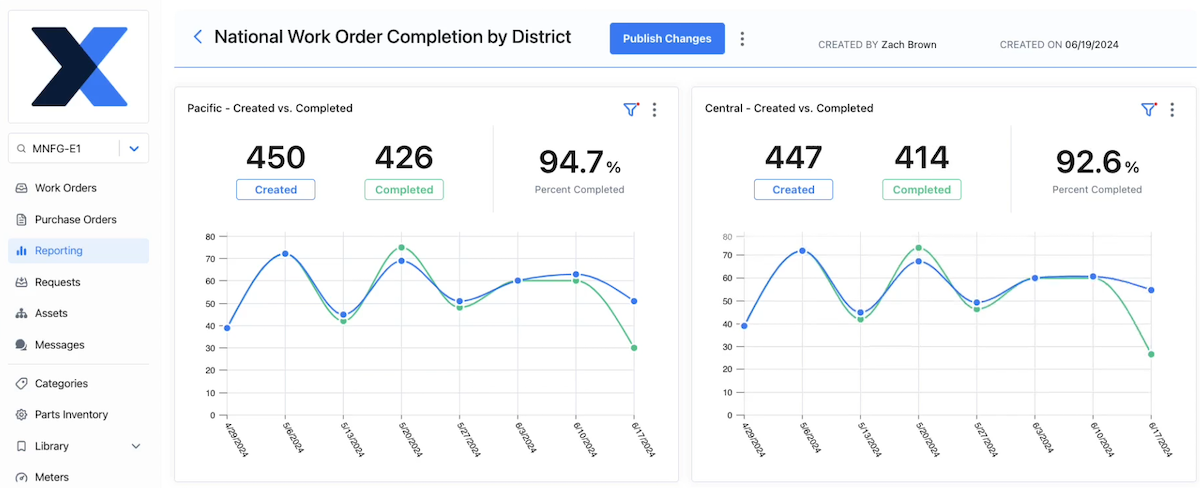
4. Implement cross-site reporting
Once reporting works at the site level, you can start building visibility across the network. Instead of managing plants individually, you can begin to see patterns, like:
- Which sites are consistently outperforming others
- Where downtime is concentrated
- How costs vary across similar operations
- Where performance is improving or slipping
One of the biggest mistakes here is treating cross-site reporting like a leaderboard. Ranking sites without context often leads to the wrong conclusions and decisions. For example, a plant with higher downtime might have been dealing with producing a new product line that caused a machine to deal with more micro stoppages.
The goal is to understand this variation and what it means for your decision-making processes. That includes:
- Comparing similar sites or asset classes where possible
- Using consistent timeframes
- Layering context on top of the numbers
Done well, cross-site reporting helps you ask better questions:
- Why is Site A improving while Site B is flat?
- Why are costs higher in one region?
- What’s driving differences in repair time?
5. Define the decision-making process
This is the step that turns reporting into results. Even with clean, standardized, cross-site data, nothing changes unless someone is responsible for acting on it. You need to define how reporting feeds into decisions, including:
- What gets reviewed and when it gets reviewed
- Who is responsible for reviewing it
- What actions are expected when something changes
Without this, reporting becomes passive. Teams generate reports, review them briefly, and move on while the same issues show up month after month. But with a defined process, reporting becomes part of how the organization operates. For example:
- A monthly review might focus on downtime trends across sites, with clear follow-ups for outliers
- A weekly check-in might track PM compliance and backlog levels, triggering immediate action if thresholds are missed
- Quarterly reviews might focus on cost trends and capital planning decisions
Over time, this creates a rhythm:
- Data highlights an issue
- Teams investigate the cause
- Actions are taken
- Results show up in the next cycle

Seven multi-site maintenance metrics to track
Once your reporting structure is in place, the next question is what to actually track. It’s important to remember that more data doesn’t always mean more clarity. Rather, it’s about which data you have, how you view it, and the decisions it allows you to make.
The metrics below show up consistently in high-performing multi-site teams because they allow you to consistently take action and continually improve your maintenance operations.
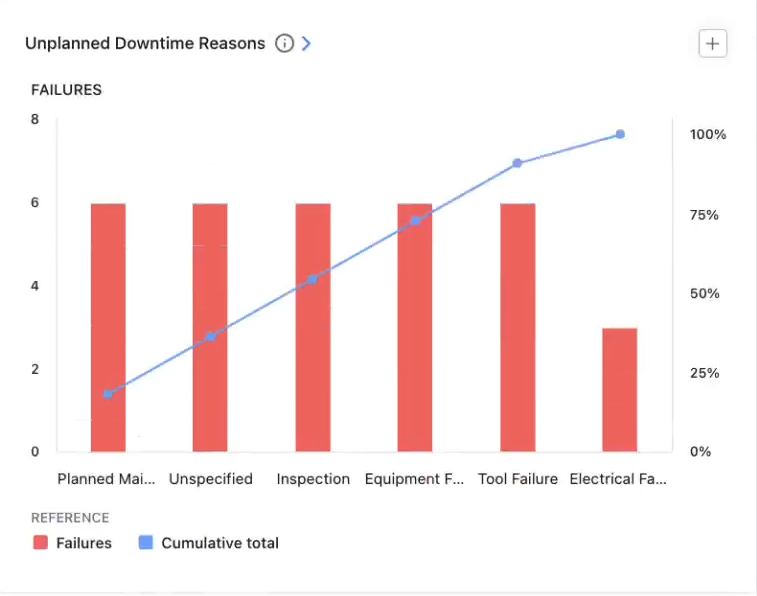
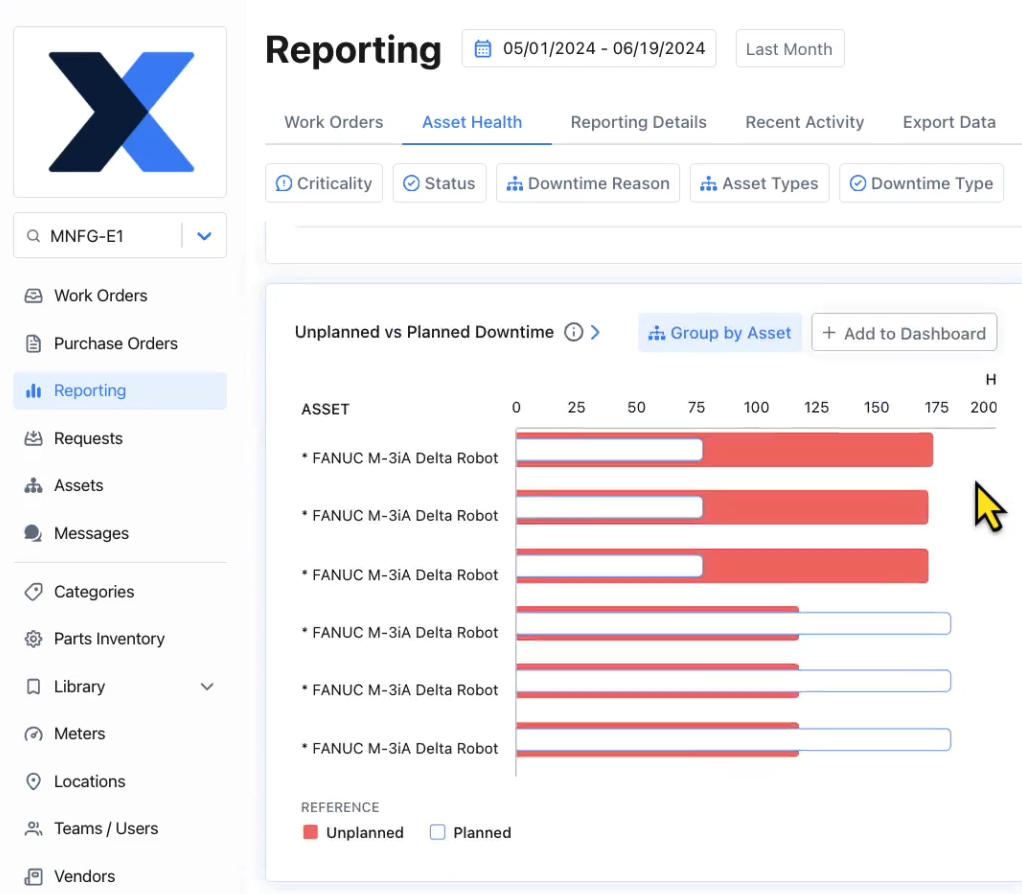
1. Downtime and downtime causes
Downtime is the most direct connection between maintenance and production impact. While downtime can be valuable on its own, the real impact comes from pairing it with failure modes, especially in a multi-site environment. This allows you to understand why downtime is happening, trends in the causes, and solutions that scale.
Across sites, this helps you identify which plants are driving the majority of downtime, if the same assets or failure types are showing up repeatedly and if a failure is a systemic problem vs. a one-off issue.
Having this data enables you to:
- Prioritize reliability efforts where they will have the biggest impact
- Identify recurring failure patterns across sites
- Decide where root cause analysis or engineering support is needed
2. Planned maintenance percentage
A higher percentage of planned work generally means the team is controlling when maintenance happens. A lower percentage usually means the team is reacting to breakdowns. Across sites, this metric helps you see:
- Which plants are stuck in reactive mode
- Where planning and scheduling are breaking down
- Whether improvement efforts are actually shifting the balance
Having this data enables you to:
- Identify sites that need support in planning and scheduling
- Track progress from reactive to proactive maintenance
- Decide where to invest in PM optimization or staffing
3. Mean time to repair (MTTR)
At a single site, MTTR is useful for improving repair processes. Across sites, it becomes a way to compare execution efficiency. If one plant consistently repairs similar equipment faster than another, that difference usually comes down to:
- Better procedures
- Better access to parts and information
- Clearer communication
- More experienced teams
Having this data enables you to:
- Identify process or training gaps between sites
- Highlight best practices that can be replicated
- Improve repair speed without increasing headcount
4. Maintenance cost (by site, maintenance type, and/or asset)
Cost data only becomes useful when it’s structured in a way that allows fair comparison. Looking at total maintenance spend alone can be misleading, especially across sites with different production volumes or asset profiles. The goal is to understand how costs vary relative to:
- Output
- Asset mix and maintenance types
- Operating conditions
Having this data enables you to:
- Identify sites that are overspending relative to peers
- Understand whether higher cost is justified by higher output or complexity
- Support budgeting and resource allocation decisions
5. Preventive maintenance (PM) compliance
PM compliance shows whether planned maintenance is actually being executed. Across sites, it becomes a leading indicator of future risk. Sites with consistently low PM compliance tend to see more:
- Unexpected failures
- Reactive work
- Variability in performance
Having this data enables you to:
- Identify sites at risk of increased downtime
- Hold teams accountable to planned work
- Decide where to adjust PM schedules or resources
6. Inspection failure rate and corrective follow-through
A PM program is only as effective as its ability to find and fix failure before it stops equipment. If you know that inspections are finding too many or too few smaller failures, or if corrective work isn’t getting completed, it allows you to right-size your preventive maintenance schedule, which cuts down on extra costs and downtime. This optimization can be done on a larger scale when comparing across sites.
Having this data enables you to:
- Identify gaps between detection and action
- Understand whether inspections are preventing failures or just documenting them
- Improve follow-through and accountability
7. Parts consumption
Parts usage is one of the biggest drivers of maintenance cost and one of the least visible without good reporting. Across sites, this metric helps you see:
- Which plants are consuming the most parts
- Whether usage patterns are consistent
- Where inventory may be overstocked or understocked
Differences here often point to deeper issues, like frequent failures, poor planning, inconsistent repair practices, or lack of standardization in parts usage
Having this data enables you to:
- Identify cost drivers tied to parts consumption
- Improve inventory planning across sites
- Reduce waste without increasing risk
How to analyze multi-site data to make decisions
Collecting and standardizing data is only half the job. The real value comes from how you use it. Many teams build solid reporting, but still struggle to turn it into action. Here are five ways to avoid this pitfall and use your data to drive decision-making.
Segment your data
Looking at a single, rolled-up metric for your sites only gives you surface-level answers. Segmentation is how you understand what’s actually driving those numbers so you can decide what to do about it.
For example, you should segment MTTR by site, asset group, and failure mode to understand if one site has better procedures and processes for fixing a certain critical failure mode more efficiently. You can then apply those procedures and processes across all facilities to significantly reduce repair times while increasing throughput.
Other ways to segment site-by-site data include:
- Downtime by asset class or failure mode: See if issues are systemic across sites or isolated to specific equipment
- Maintenance cost by production volume: Understand if higher spend is justified or inefficient
- Parts usage by asset or failure type: Uncover cost drivers and recurring issues
- Found failure rate by asset group: Identify if certain practices are better at spotting early failures
- Cost by maintenance type: Find out where efficiencies can be gained and waste can be cut
Diagnose across people, process, and systems
When going deeper into why numbers are what they are across sites, it helps to frame the investigation around three factors:
- People (training, staffing, experience)
- Process (planning, scheduling, procedures)
- Systems/tools (CMMS usage, data quality, access to information)
For example:
- High MTTR at one site could be a training issue, a parts availability issue, or a documentation issue
- Low PM compliance could be caused by unrealistic schedules, staffing shortages, or poor planning
Looking at only one or none of these factors often points you in the wrong direction completely or to a short-term fix instead of a long-term solution that can be applied across sites.
Find what your best sites are doing and scale it
One of the biggest advantages of multi-site operations is that you already have internal benchmarks. Some sites are doing things better. The opportunity is to understand why by asking:
- What is the best-performing site doing differently?
- What processes, tools, or habits are driving that performance?
In many cases, the answer is not a major transformation. It is a set of small, consistent practices, like:
- Better planning routines
- Clearer procedures
- Stronger discipline in data capture
Those are easier to replicate than large, one-off initiatives.
Look for data gaps and inconsistencies
Sometimes the most important insight is not in the data, it’s what’s missing. If one site consistently reports fewer failures, is it actually performing better? Or is it capturing less data? If parts usage looks unusually low, is that efficiency or incomplete tracking?
Good analysis includes questioning the data itself:
- Are fields being filled out consistently?
- Are definitions being followed?
- Are certain sites underreporting or over-reporting?
Catching these issues early prevents bad decisions later.
Start with questions, not dashboards
The most effective teams do not start by reviewing reports. They start with questions. For example:
- How can we lower maintenance costs by 10% across all sites?
- What is the main driver of downtime across critical production assets?
- How can we make repairs more efficient so we can increase capacity?
The reporting then becomes a tool to answer those questions. This keeps analysis focused and practical. Instead of scanning dashboards for interesting numbers, teams are using data to solve specific problems.
Multi-site maintenance reporting is the key to amplifying efficiency at your operation
Done well, multi-site maintenance reporting helps you move from reactive, site-by-site problem solving to consistent, data-driven performance. It gives you a clearer view of where downtime is coming from, where costs are drifting, and where your biggest opportunities are.
And just as important, it gives you a way to communicate that clearly to the rest of the business. Because at the end of the day, reporting is not about tracking maintenance activity.It is about helping your organization make better decisions about uptime, cost, and risk across every site.

Marc Cousineau is the Senior Content Marketing Manager at MaintainX. Marc has over a decade of experience telling stories for technology brands, including more than five years writing about the maintenance and asset management industry.

.webp)
.webp)
.webp)