

Maintenance reporting is not about having the numbers, but rather about being able to find answers to the questions you have within those numbers. Simply knowing how much downtime there was last month or what you spent this quarter is not enough if you can’t go a layer deeper and understand why the numbers are the way they are.
Creating structure around your data allows you to segment and filter it in ways that get you to those answers. And one of the best ways to put that structure on data is through work order tags or work order categorization.
In this article, you’ll learn best practices for tagging work orders and seven different ways to categorize maintenance work to improve your reporting.
Key takeaways
- Work order tags turn raw maintenance data into answers. Without consistent categorization, it’s difficult to understand what’s driving downtime, cost, or inefficiency.
- A small set of well-defined work order categories, like work type and asset group, can unlock most of the insights teams need.
- Design tags around the decisions you want to make. Whether it’s improving PM effectiveness or identifying bad-actor assets, tagging should support operational questions.
- Breaking data down by work type, asset group, failure mode, priority, inspection type, and location helps uncover reliability hotspots, cost drivers, and opportunities to optimize maintenance.
Seven best practices for tagging work orders
The best work order tagging systems are simple enough for technicians to use quickly but structured enough to produce meaningful insights you can act on. Here are seven best practices for achieving this balance:
1. Use a small set of core categories
Start with a few structured fields that answer the most important questions, like what work was done, where, and why. Too many tags create confusion and inconsistent data.
2. Create controlled pick lists over free text
Use predefined options instead of letting users type their own tags. This prevents variations like “motor,” and “electric motor” as well as the dreaded “other” from fragmenting your reporting.
3. Work backwards from the questions you want answered to the tags you need
Design tags based on the insights you want to generate. For example, if you want to know if you’re doing more planned maintenance, make sure you tag work orders by the work type (preventive, reactive, corrective, etc.)
4. Review and clean tag lists periodically
Over time, organizations often accumulate redundant or unused tags. Review tag usage every few months and consolidate where possible.
5. Document tagging guidelines
Provide a short reference guide so everyone tags work orders the same way. For example, define reactive and corrective work orders so no one gets mixed up between the two.
6. Automate tags when possible
Reduce manual entry by automatically assigning categories based on known data. For example, auto-fill the asset group when an asset is selected for a new work order.
7. Add several tags to work orders where appropriate for better segmentation
Allow work orders to include several relevant tags so issues can be analyzed from multiple angles. This enables better segmentation in reporting, helping teams understand patterns across work type, asset group, failure mode, and other dimensions.
Seven ways to tag work orders
1. By type of work
A core way to categorize a work order is by the type of work being done. This can include:
- Preventive
- Reactive/Emergency
- Corrective/Follow-up
- Inspection
- Project
- Shutdown
- Safety
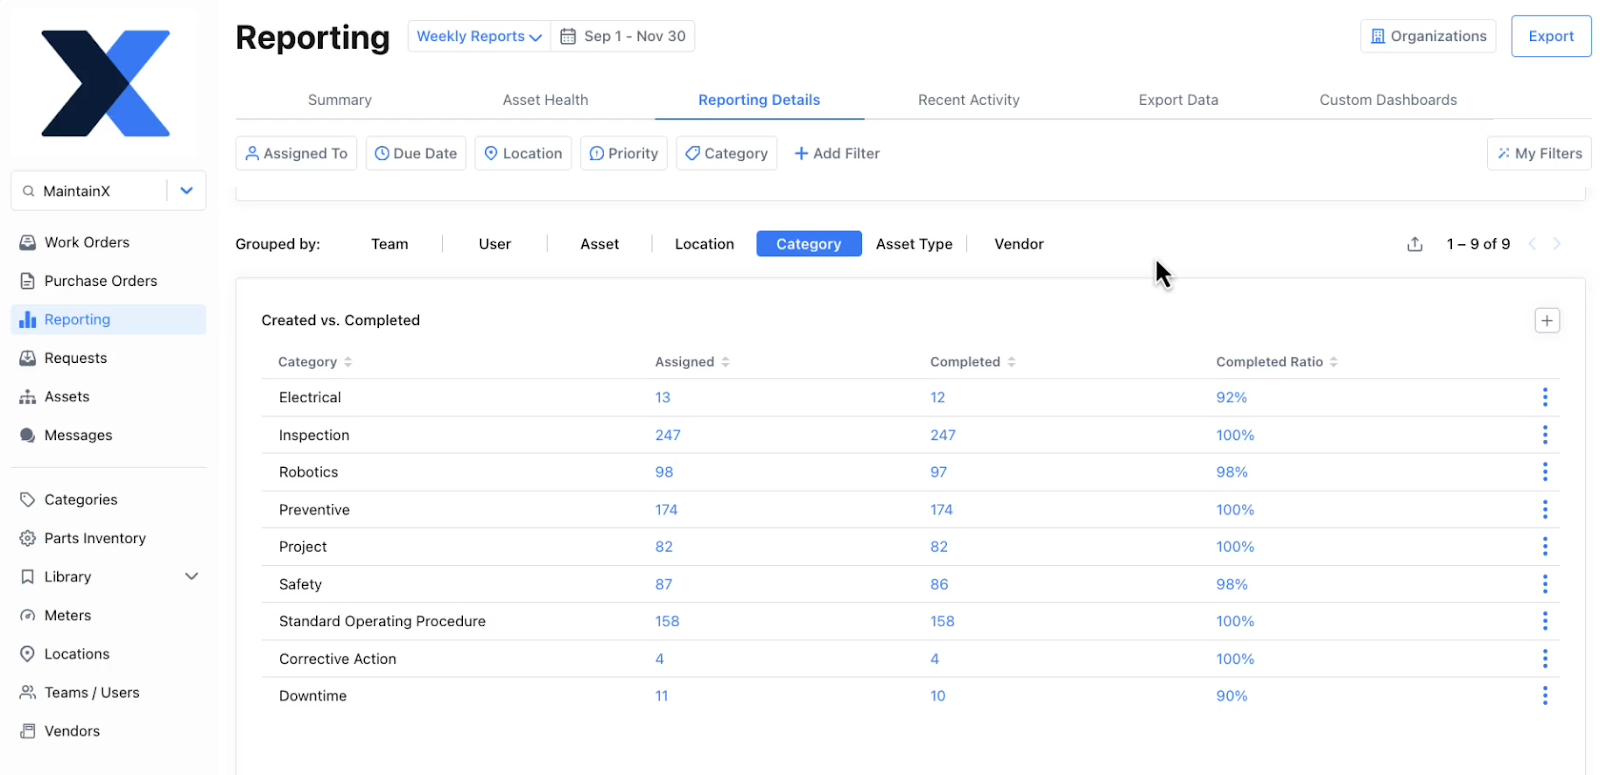
Below is an example of how tagging work orders by work type can help improve your maintenance reporting, including tracking completion rates and understanding the balance between planned and unplanned maintenance.
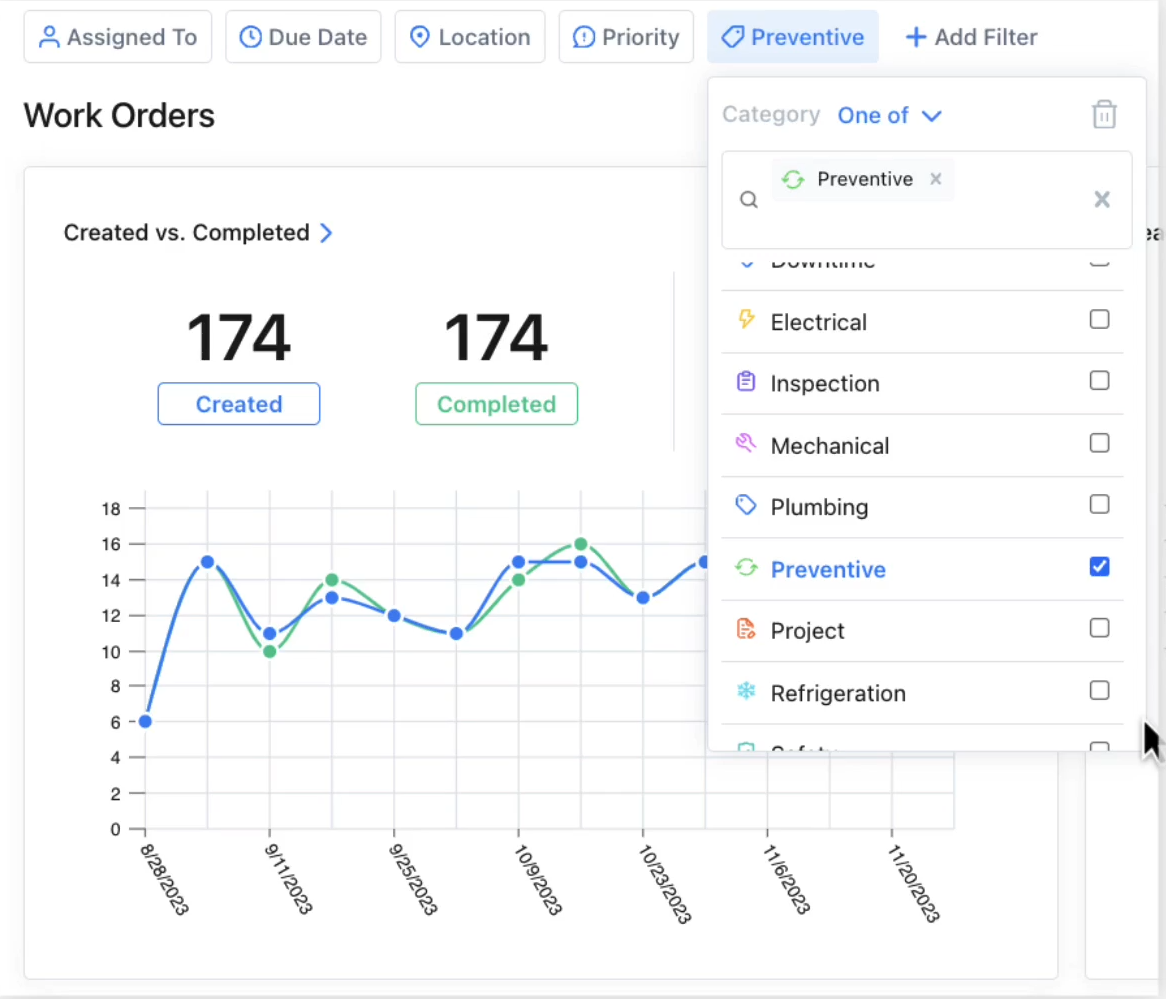
What to do with the data
When you tag work orders by work type, here are some of the insights you can start to gather:
1. Planned vs. unplanned balance: How much of your workload is planned vs. reactive. This allows you to know for sure if you’re spending more time fighting fires than preventing downtime so you can dig deeper into the reasons and fix them.
2. Cost and labor distribution: Find out which types of work lead to more labor hours and money spent, including overtime, contractors, and parts.
3. Downtime tracking and production impact: Identify the types of work orders that cause the most downtime and the impact of these events on production. Once you know generally what is causing the most downtime, you can dive into the specific work orders causing the most trouble and pinpoint ways to be more efficient.
4. Effectiveness of preventive maintenance: These tags can help you understand if your PMs and inspections are actually preventing reactive work and if inspections are finding failures that can be corrected before breakdowns happen.
5. Audit readiness: You can use these categories to track the completion of safety and compliance work, then build a digital audit trail ahead of regulatory audits.
6. Root cause and repeat failures: You’ll be able to see if corrective and reactive work is clustered around certain assets, shifts, production windows, products, or procedures so you can determine the root cause and prevent repeat failures.
2. By component or asset type
You can split work orders by the type of component or asset being worked on, such as:
- Electrical
- Mechanical
- Pneumatic
- Refrigeration
- Fleet
- Facilities
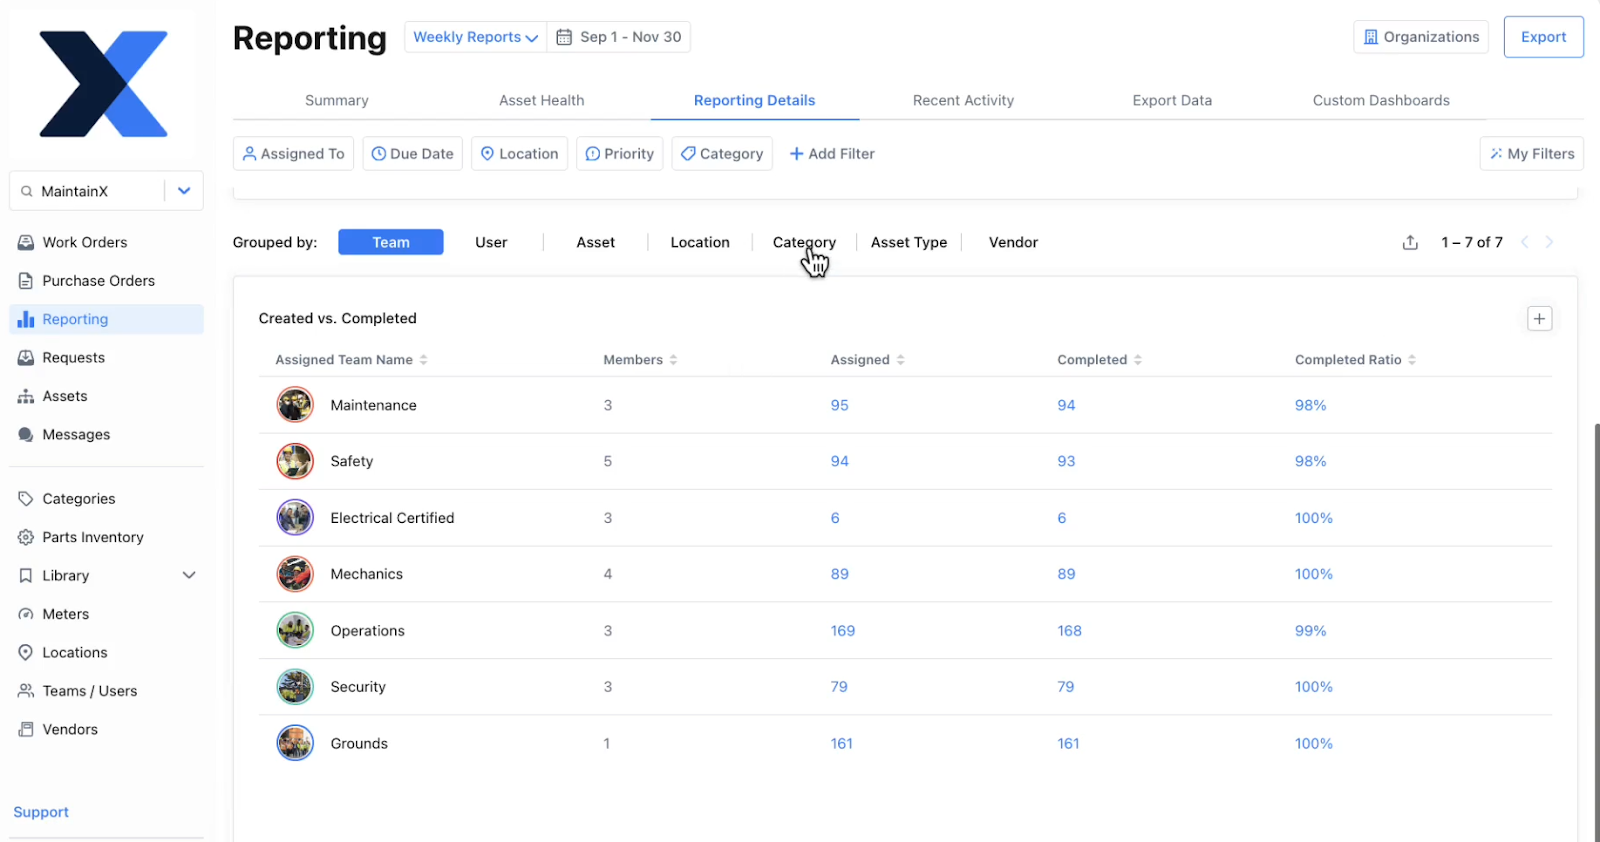
Here is an example of how categorizing work orders by asset type or component can help you quickly track your backlog, completion rate, and flag any potential issues with your schedule so you can look deeper and catch any broken processes.
What to do with the data
1. Reactive workload concentration: See which systems generate the most reactive or corrective work orders so you can focus planning, staffing, training, and PM coverage on hotspots. For example, if there is repeat corrective work on electrical components, you can work with plant management to deliver better training on this equipment to operators.
2. Downtime causes and reduction: Identify which asset types drive the most stoppages so you can prioritize reliability projects or redesigns that reduce production loss.
3. Budget allocation: View which component or asset types cost the most to maintain. This allows you to look into ways to spend more efficiently, from finding ways to speed up repairs on certain types of assets to negotiating better prices with vendors.
4. Skills and resources required: This category will highlight the mix of skills you need and how you can hire, cross-train, or schedule contractors more efficiently.
5. Failure patterns and predictability: You can surface recurrence, seasonality, and detection-method trends for specific asset types, telling you where condition-based maintenance or predictive maintenance might deliver the biggest ROI.
3. By asset group
You can also tag your work orders by asset group, which might look like:
- Conveyors
- Wrappers
- HVAC
- Motors
- Production line
- Office
What to do with the data
1. Response and repair times: Track which asset groups have the longest response time and mean time to repair (MTTR) versus targets so you can remove process blockers. For example, if MTTR is high on conveyors, check if SOPs are clear enough as incomplete or vague instructions can increase repair times.
2. Workload concentration and backlog: Reveals which asset groups generate the most open work orders and backlog so you can reallocate resources and fine-tune PM frequencies. For example, if wrappers consistently account for a large portion of open work orders, create a recurring maintenance slot to reduce backlog and production disruption.
3. Repair vs. replace decisions: Compare the average costs and reactive work done on an asset group to the worst performing asset in the group. This will allow you to make more informed repair or replace decisions.
4. Cost breakdown: Break maintenance spend down by asset group so you can find ways to spend more efficiently. For example, if motors show high outside-service and parts costs, you might increase the minimum inventory part for critical spares to avoid rush orders.
5. Repeat failures and reliability hotspots: Surface asset groups with frequent repeat work so you can run RCAs, change PM scopes, or pursue engineering fixes to eliminate root causes. For example, if conveyors repeatedly present the same failure code, perform an RCA and consider updating PM intervals or instructions.
6. PM effectiveness: Identify whether PMs for each asset group are preventing breakdowns. Low planned-to-reactive ratios indicate PM scope/frequency issues or ineffective inspections. For example, if office assets have mostly reactive tickets despite scheduled checks, simplify PM tasks or add condition checks so inspections drive corrective work before failures occur.
4. By asset criticality or work order priority
This one is pretty straightforward—you can group work orders by the following criticality or priority:
- Emergency
- High
- Medium
- Low
What to do with the data
1. Work prioritization accuracy: Determine whether the priority assigned to work orders reflects actual operational impact. This allows you to audit priority definitions and retrain requestors if too many tasks are marked urgent. For example, if a large percentage of work orders are labeled “High” but have little impact on production, you may need clearer priority guidelines.
2. Response and repair times: Track if the team meets expected response times and MTTR for different priority levels. This helps identify bottlenecks that prevent urgent issues from being resolved quickly. For example, if emergency work has consistently long response times, it may indicate gaps in parts availability or escalation procedures.
3. Operational risk: Find out how much work falls into high-risk categories so you determine you should do more frequent PMs. For example, if more work orders are being marked as an emergency on production assets, you might talk to plant management about taking the first 30 minutes of a shift to inspect and do routine maintenance to avoid longer stoppages.
4. Resourcing and emergency planning: See how often urgent tasks disrupt planned maintenance schedules and force technicians to shift focus to urgent tasks. This will help you determine if better planning processes are required. For example, if high criticality tasks frequently interrupt scheduled work, you might create a rapid-response crew or emergency part kits so the team can respond quicker and get back to planned work faster.
5. Backlog management: Identify if high-criticality work orders are accumulating in the backlog. This helps you rebalance workloads and prevent high-risk failures from occurring because of missed work.
5. By failure type
If you want to get to the bottom of downtime, unnecessary costs, bad actors, and inefficiency, your best bet is to classify corrective and reactive work orders by failure type, including:
- Mechanical failure
- Electrical failure
- Hydraulic failure
- Operational failure
- Control failure
What to do with the data
1. Bad-actor assets: When failure type data is combined with reactive or corrective work orders, it helps reveal assets that repeatedly fail in the same way. This allows you to identify bad actors and prioritize deeper root cause analysis or replacement decisions instead of continuing routine repairs.
2. Recurring root causes: See which failure modes occur most frequently so you can focus your maintenance strategy on the biggest underlying problems. This helps you run targeted root cause analyses and eliminate repeat issues. For example, if bearing failures appear frequently, you might review lubrication schedules and alignment guidelines.
3. PM effectiveness: Find out if existing PMs are preventing the types of failures they are meant to detect or mitigate. This allows teams to update inspection tasks or frequencies when certain failures continue to occur.
4. Parts and inventory planning: Identify which failure types consume the most replacement parts so you can optimize spare parts stocking and avoid delays during repairs. This ensures the right components are available when failures occur.
5. Training and installation needs: Determine if certain failures are caused by improper installation, setup, or operating practices. This way, you can improve procedures or provide targeted training. For example, if misalignment failures frequently occur after maintenance work, technicians may need improved alignment procedures or tools.
6. Maintenance strategy optimization: If the same failure type keeps occurring between scheduled PMs, it’s a strong signal your time-based PMs aren’t catching the failure mode. It’s also a good starting point for considering if condition-based monitoring on the asset would be a useful investment.
6. By inspection type
You can further segment your PMs or inspections into different categories. Some ways you can tag these work orders include:
- Routine
- Safety and compliance
- Operator
- Seasonal
- Start up
- Spec change
- Daily
What to do with the data
1. Inspection effectiveness: See if inspection programs are actually detecting issues early by tracking how often inspections lead to corrective work orders. This helps you evaluate which inspection types are valuable and where procedures may need improvement.
2. Compliance and audit readiness: Demonstrate that required regulatory or safety checks are being completed consistently. This ensures compliance-related work is tracked and documented properly.
3. Completion rate: Tracking completion rates by inspection type shows whether critical inspection programs are being executed consistently or if tasks are being missed. This helps identify gaps in scheduling, staffing, or prioritization so you can ensure important inspections actually happen.
4. Preventive vs reactive discovery: Find out if issues are being caught during inspections or only after failures occur. This helps teams strengthen inspection programs so problems are discovered before they cause downtime.
7. By location or shift
Tagging work orders by location is a good way to understand resource allocation and make sure you’ve set up your schedule and materials in a way that maximizes efficiency. The categories you use can include:
- Site
- Area
- Plant/Office
- Shift/team
Segmenting work orders by team or shift can reveal differences in workload, response times, or completion rates. This helps organizations identify training opportunities, staffing gaps, or process differences that may affect reliability.
What to do with the data
1. Maintenance hotspots: Identify operational or environmental factors that increase equipment issues. This allows teams to focus improvement efforts on the locations creating the most maintenance demand. For example, if one production area produces more work orders, investigate environmental factors such as dust, vibration, or operator practices that may be accelerating wear.
2. Downtime impact by area: See which locations cause the most downtime or operational disruption, helping prioritize reliability improvements or resource allocation. This ensures attention is focused on the areas with the greatest operational impact. For example, if downtime is high in a far corner of a plant, it may be because of travel time to collect information or parts. In this scenario, you can create local parts shelves and add QR codes that link to digital asset manuals.
3. Resource planning and technician coverage: Identify where maintenance work is concentrated, helping planners assign technicians, tools, and spare parts more efficiently. This improves response times and reduces travel or coordination delays.
4. Shift-based or team-based maintenance patterns: When location data is combined with shift information, it can reveal whether certain areas experience more failures or work orders during specific shifts or by specific teams. This helps identify operational differences, staffing gaps, or environmental factors that may be affecting reliability.
Add structure to your maintenance reporting with work order categories
Maintenance data becomes powerful only when it’s structured in a way that allows you to answer questions and take action based on those answers. Tagging and categorizing work orders creates that structure, helping teams move beyond surface-level metrics and understand the real drivers behind downtime, cost, and inefficiency.
By applying a small set of clear tagging standards and segmenting work orders in meaningful ways, you can turn everyday maintenance activity into actionable insights. Over time, those insights help teams improve preventive maintenance programs, allocate resources more effectively, and make smarter repair, replacement, and reliability decisions.

Marc Cousineau is the Senior Content Marketing Manager at MaintainX. Marc has over a decade of experience telling stories for technology brands, including more than five years writing about the maintenance and asset management industry.


.webp)