

We’re living in the golden age of digitization—there’s no shortage of data, AI tools, and resources to tap into to get maintenance operations in peak form.
Maybe that’s why it’s so frustrating when maintenance operations falter. Despite rapid digitization, examples of digital tools helping to dramatically reduce downtime and increase productivity are still the exception rather than the rule, according to this McKinsey report.
The entire industrial sector is struggling with this challenge. The cost of unscheduled downtime sits at $1.4 trillion globally. So, what gives?
The same McKinsey article suggests that the solution is simple: put all that valuable data in front of the people who need to see it, when they need to see it. One of the best ways to do this is to build a work order dashboard, which is a centralized visual snapshot of a maintenance team’s workload. Using a dashboard enables digital work management (DWM), which has been shown to reduce maintenance costs by up to 30%.
In this guide, we’ll cover best practices for creating a work order dashboard that shows an accurate view of maintenance operations, motivates your workforce, and drastically reduces downtime and maintenance costs.

79% of teams saw the amount of unplanned downtime stay the same or increase over the past year, and 39% say the cost of downtime is rising.
Key takeaways
- Work order dashboards provide real-time visibility into maintenance operations, helping teams reduce both unplanned downtime and maintenance costs.
- Essential KPIs to track and display include work order completion rates, mean time to repair (MTTR), preventive vs. reactive work ratios, and technician productivity metrics.
- Mobile-first dashboards enable field technicians to access critical information instantly, improving response times and work quality.
- Customizable dashboard views allow maintenance managers, technicians, and operations leaders to focus on metrics most relevant to their roles.
What is a work order dashboard for maintenance?
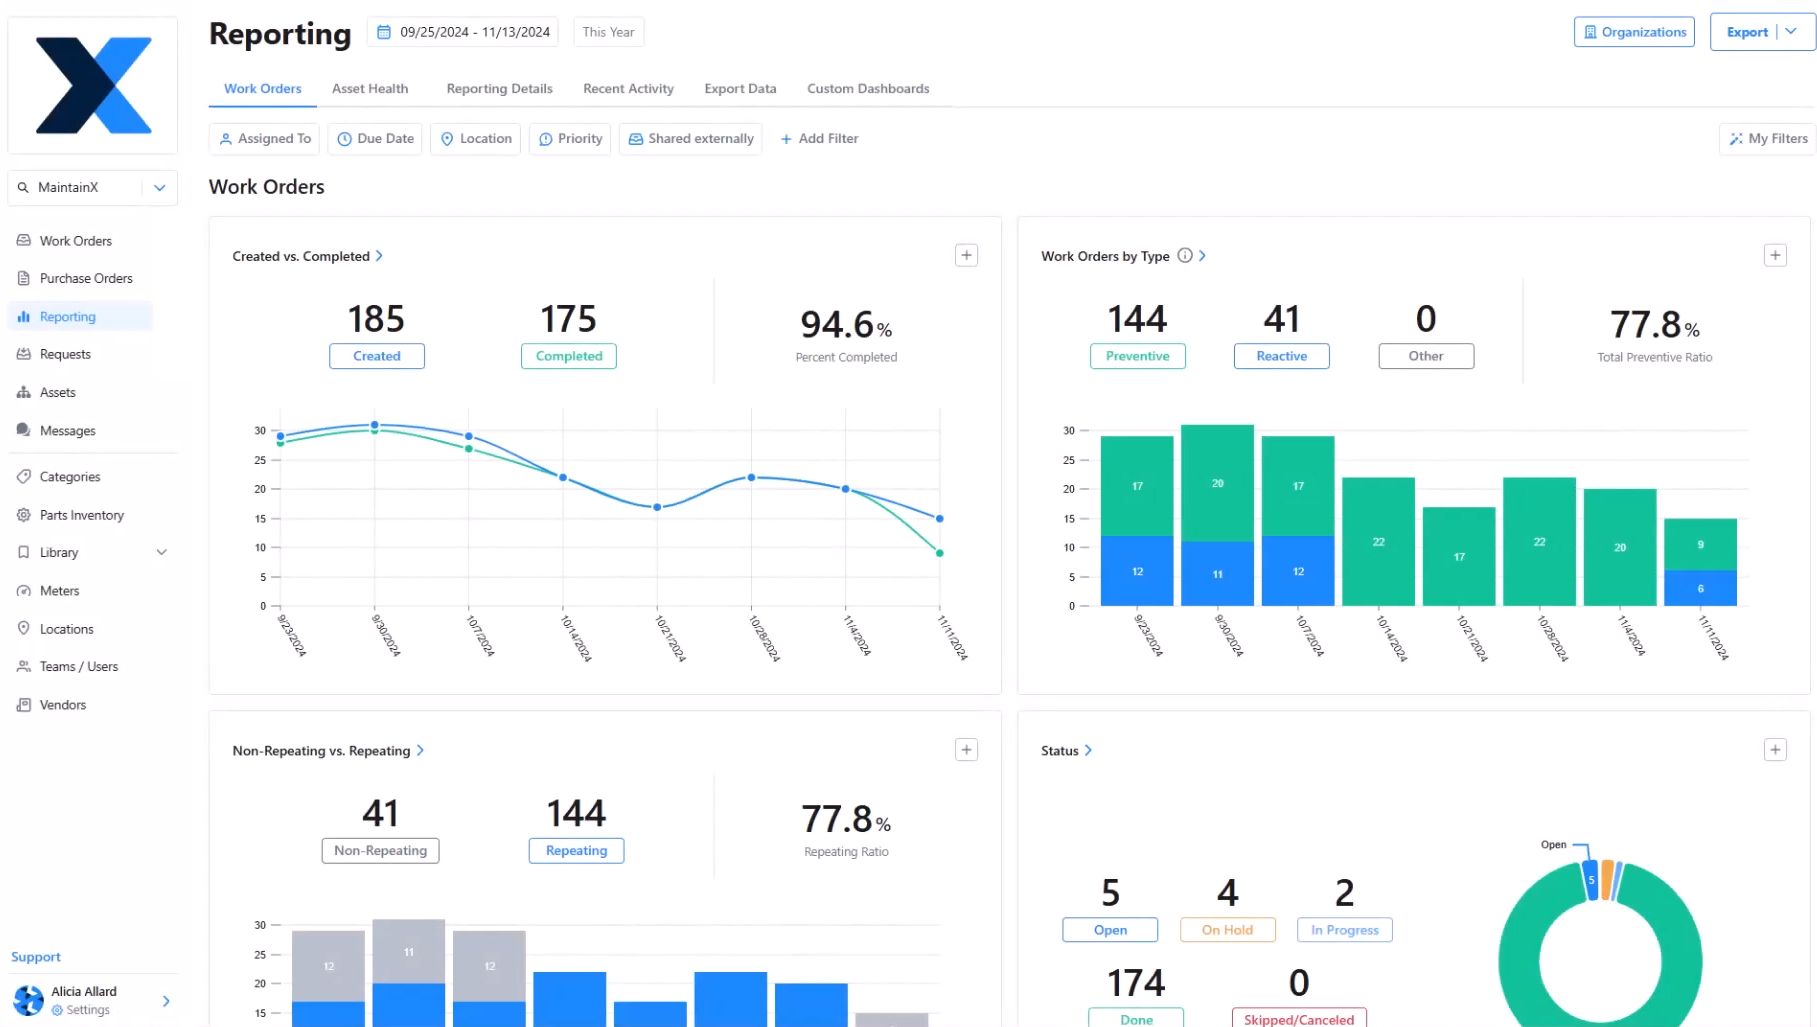
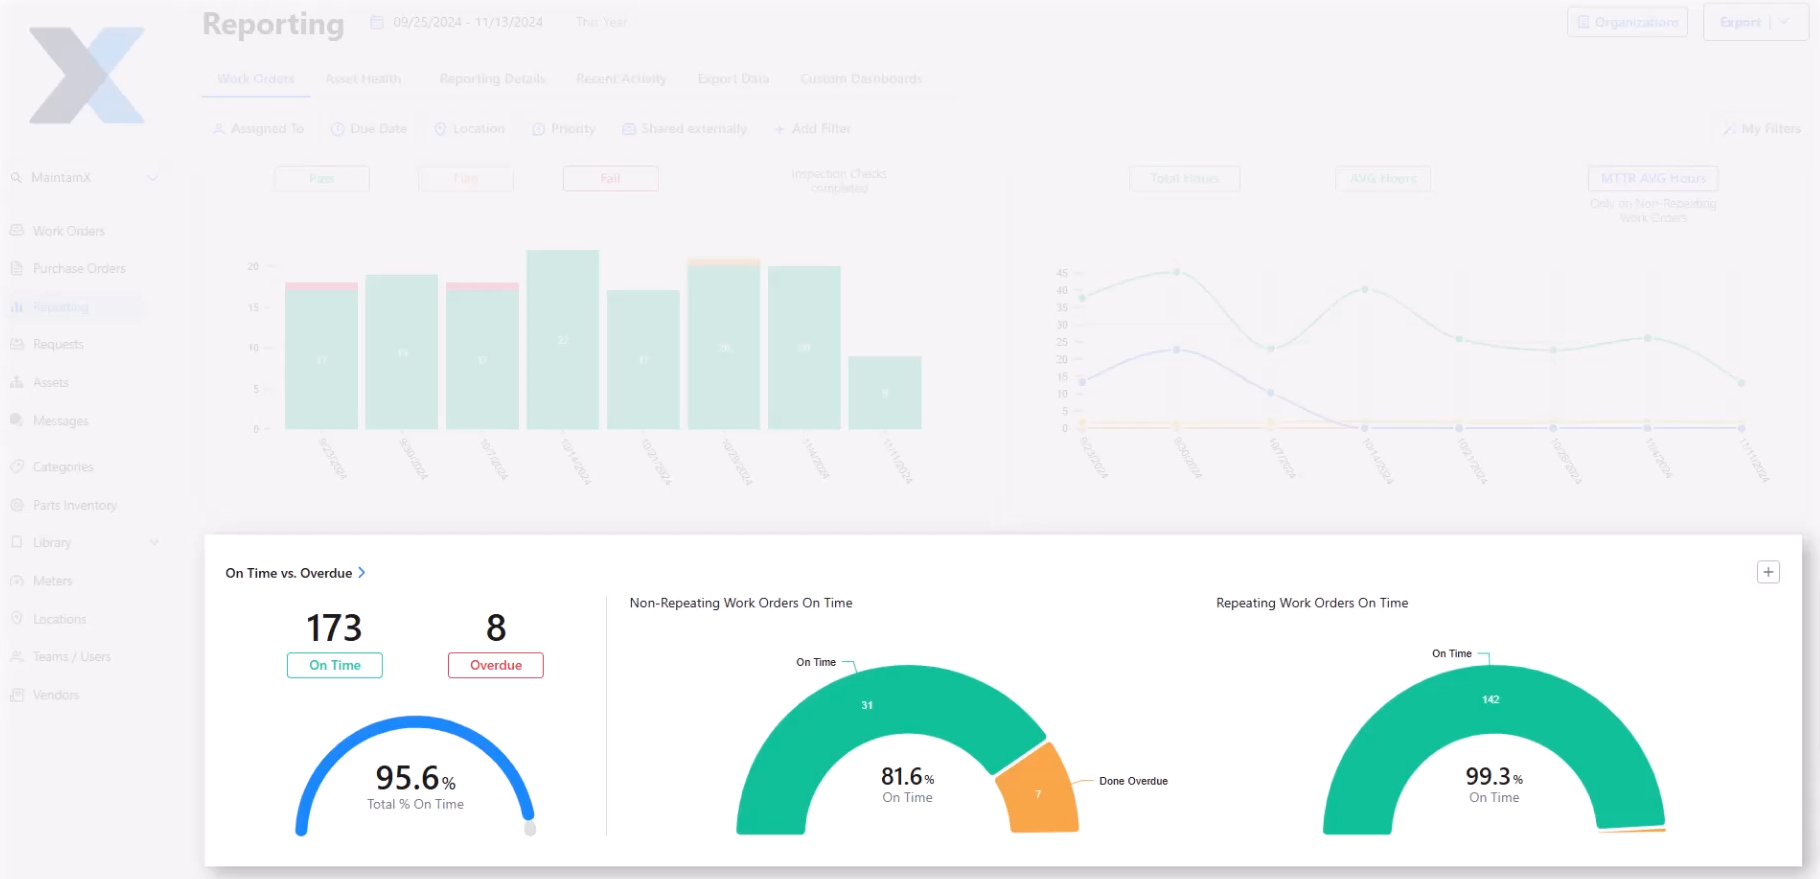
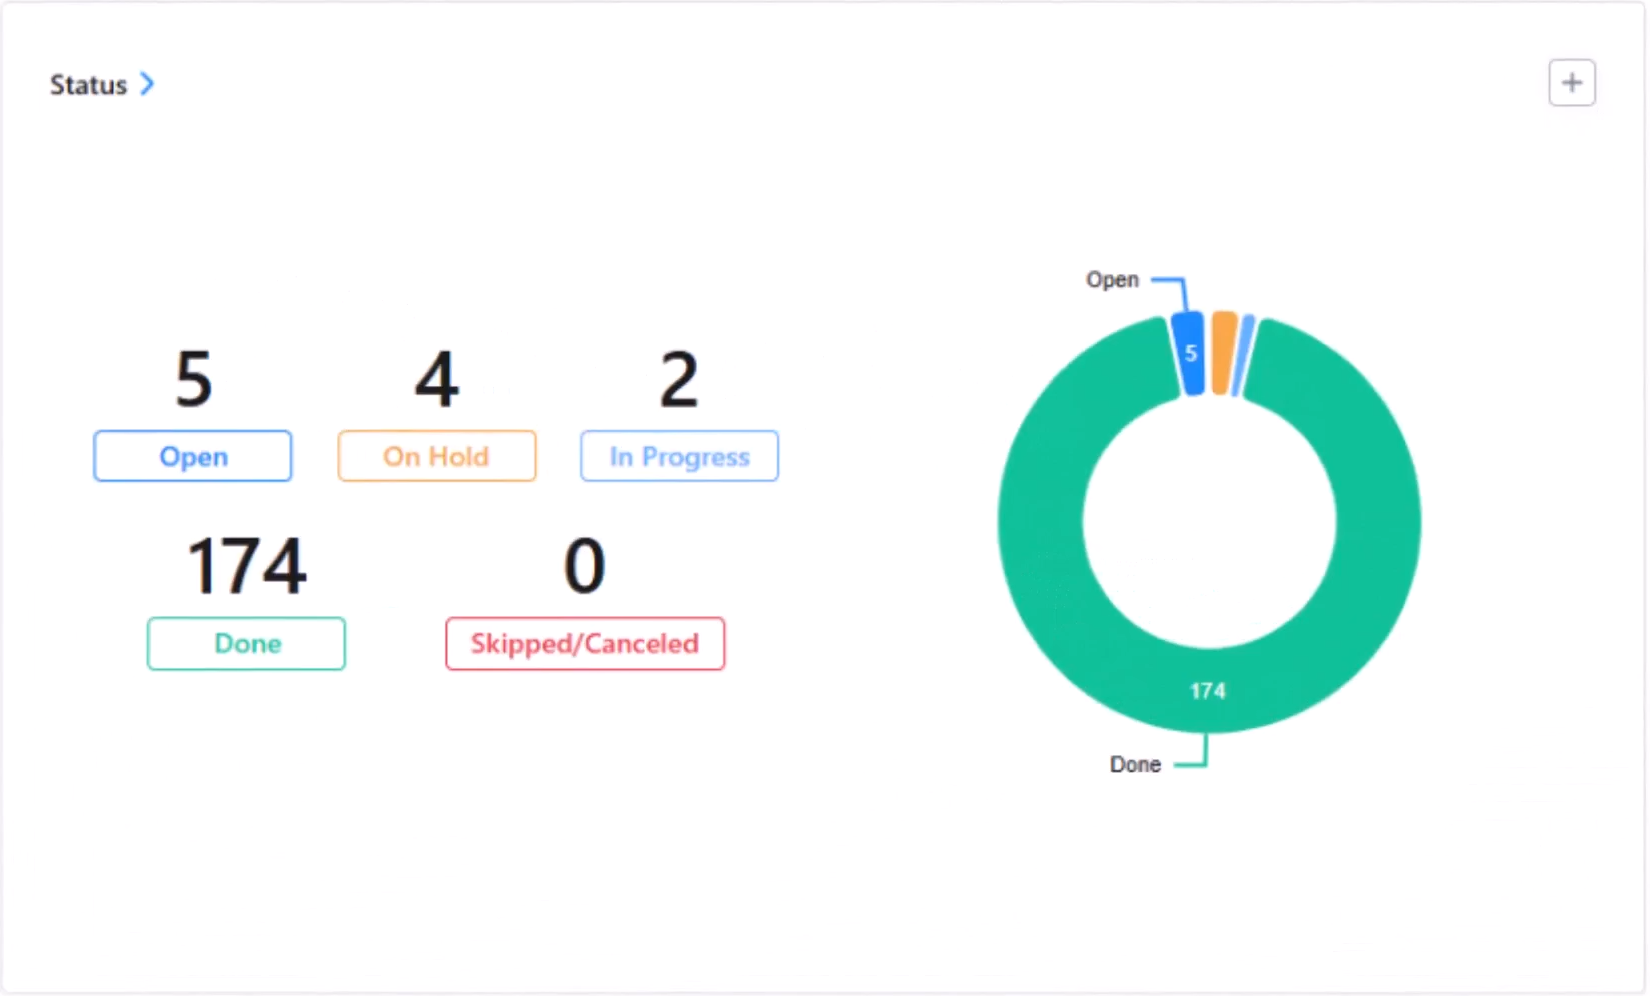
A work order dashboard is a digital display of maintenance operations. It provides an accurate, real-time glimpse into work order status, resource allocation, and maintenance team performance so that everyone, from frontline workers to resourcing managers, can make smarter, data-driven decisions.
A well-made work order dashboard will:
- Reduce response times by making urgent work orders instantly visible, along with information about who’s responsible for them.
- Ensure better resource allocation by identifying bottlenecks, overloaded technicians, and under-utilized assets before they impact productivity.
- Make proactive maintenance planning possible by providing the data that managers can use to carry out trend analyses and predictive insights.
- Improve communication between field technicians, supervisors, and management through shared visibility and increased accountability.
Work order dashboards also help you continually improve the work order management process. There’s no better way to optimize work orders than to track how they move through your organization and team. And if your dashboard paints a different picture than what you’re observing on your own, it helps you close gaps that exist between your physical and digital environments.
A great work order dashboard starts with great work orders
Before we dive into how to build an effective work order dashboard, let’s take a brief detour to touch on work orders themselves.
We’ve said this before and we’ll say it again: solutions are only as effective as the data they’re built around. For work order dashboards, that means building a foundation of detailed, relevant, and accurate work orders.
Getting accurate, contextual data relies on two things: Clarity and consistency. You need to be capturing data that clearly maps to your goals and decision-making processes while driving action. You also need to be capturing this data consistently and accurately.
When determining how to structure your work orders to capture the right data, work backwards from the actions you want to be able to take to find the right inputs for that action. For example, if you want to be able to reduce downtime on your top production assets, you need to be able to capture data like failure codes, maintenance type, repair times, failed inspections, and technician notes.
To achieve consistency in data capture, you need to design work orders and the work order process to be as easy as possible for technicians. That includes making certain fields mandatory, reducing the number of clicks needed to input data, allowing for voice-to-text note taking, and making it easy to find the inputs for certain fields, like failure codes. Using a mobile-first CMMS is an essential part of making data capture easier for frontline staff as it allows you to:
- Automate work order creation by capturing machine sensor data and condition-based alerts
- Generate strong SOPs that frontline workers can follow while completing work orders on-site (even when they’re offline)
- Enable your frontline to add valuable context to work orders with notes, photos, and instant updates that inform maintenance metrics


Key benefits of work order dashboards
The exact insights you’ll need from your work order dashboard depend on the goals you want to hit, KPIs you want to measure, and how your team operates. But the benefits of implementing a work order dashboard are universal. By setting one up, you can lean into:
Real-time data updates
The point of a dashboard is to get a snapshot of what’s going on right now. Integrating your work order dashboard with live CMMS and IoT sensor data can provide a truly instantaneous play-by-play that motivates workers and flags when anything’s amiss.
Customizable widgets and layouts
Nothing’s ever static on the shop floor, and your dashboard shouldn’t be either. A good dashboard will allow you to make adjustments until it shows exactly what you need it to at any given time, whether that’s overall efficiency, costs, or asset-by-asset comparisons.
Interactive filtering and drill-down capabilities
Dashboards can always provide a high-level view, but you should be able to dive deeper when you need to. An effective dashboard will let you filter by site, asset, worker, work order type, or time period to let you make comparisons and get the information you need.
Which maintenance KPIs should you track with a work order dashboard?
There’s no one-size-fits-all approach to building a work order dashboard. Each maintenance team is unique, and depending on organizational goals, is also held to different expectations. There are a number of KPIs to choose from when putting together a custom work order dashboard:
Work order completion metrics
Completion rate
What it is: The amount of work orders that are being completed and closed out as a fraction of the total number of work orders generated.
What it tells you: A low completion rate can be a clue that either your maintenance strategy or your resource planning needs an overhaul.
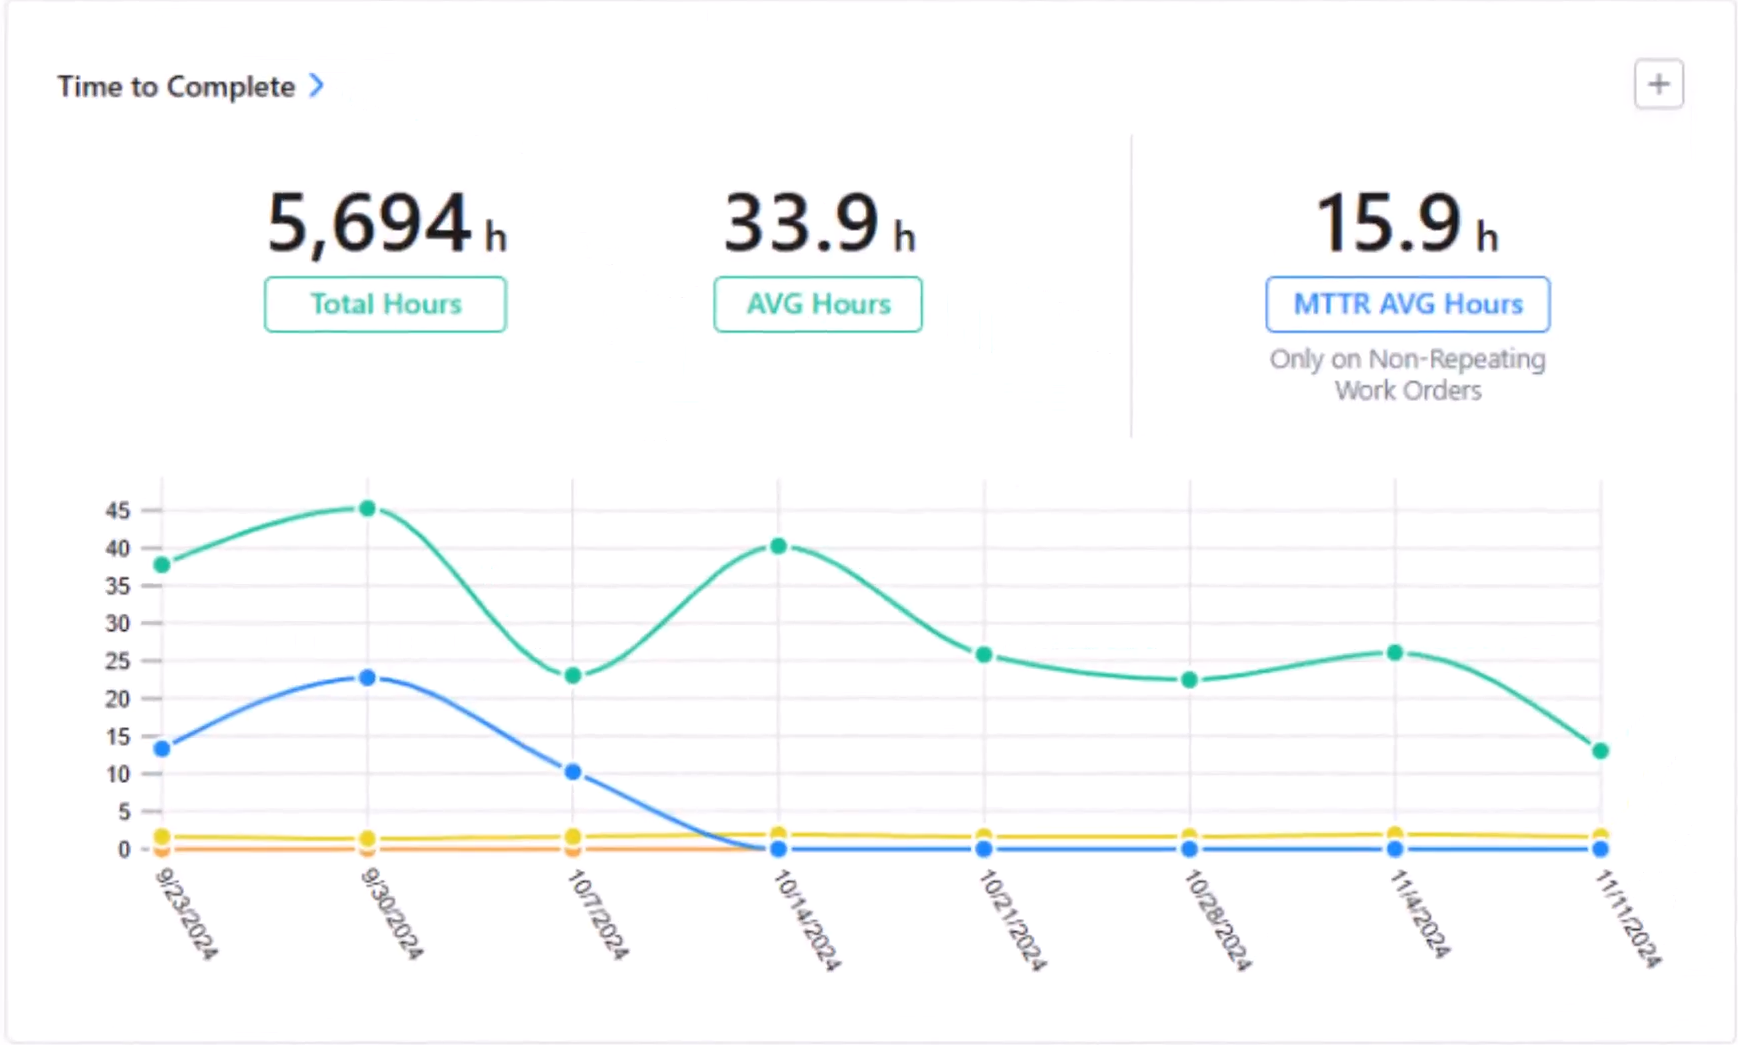
Average completion time
What it is: How much time is passing on average between a work order being created and closed.
What it tells you: Longer completion times usually point to labor shortages, workflow bottlenecks, or insufficient information at the frontline. Many shop floors gamify this metric by comparing it week-over-week.
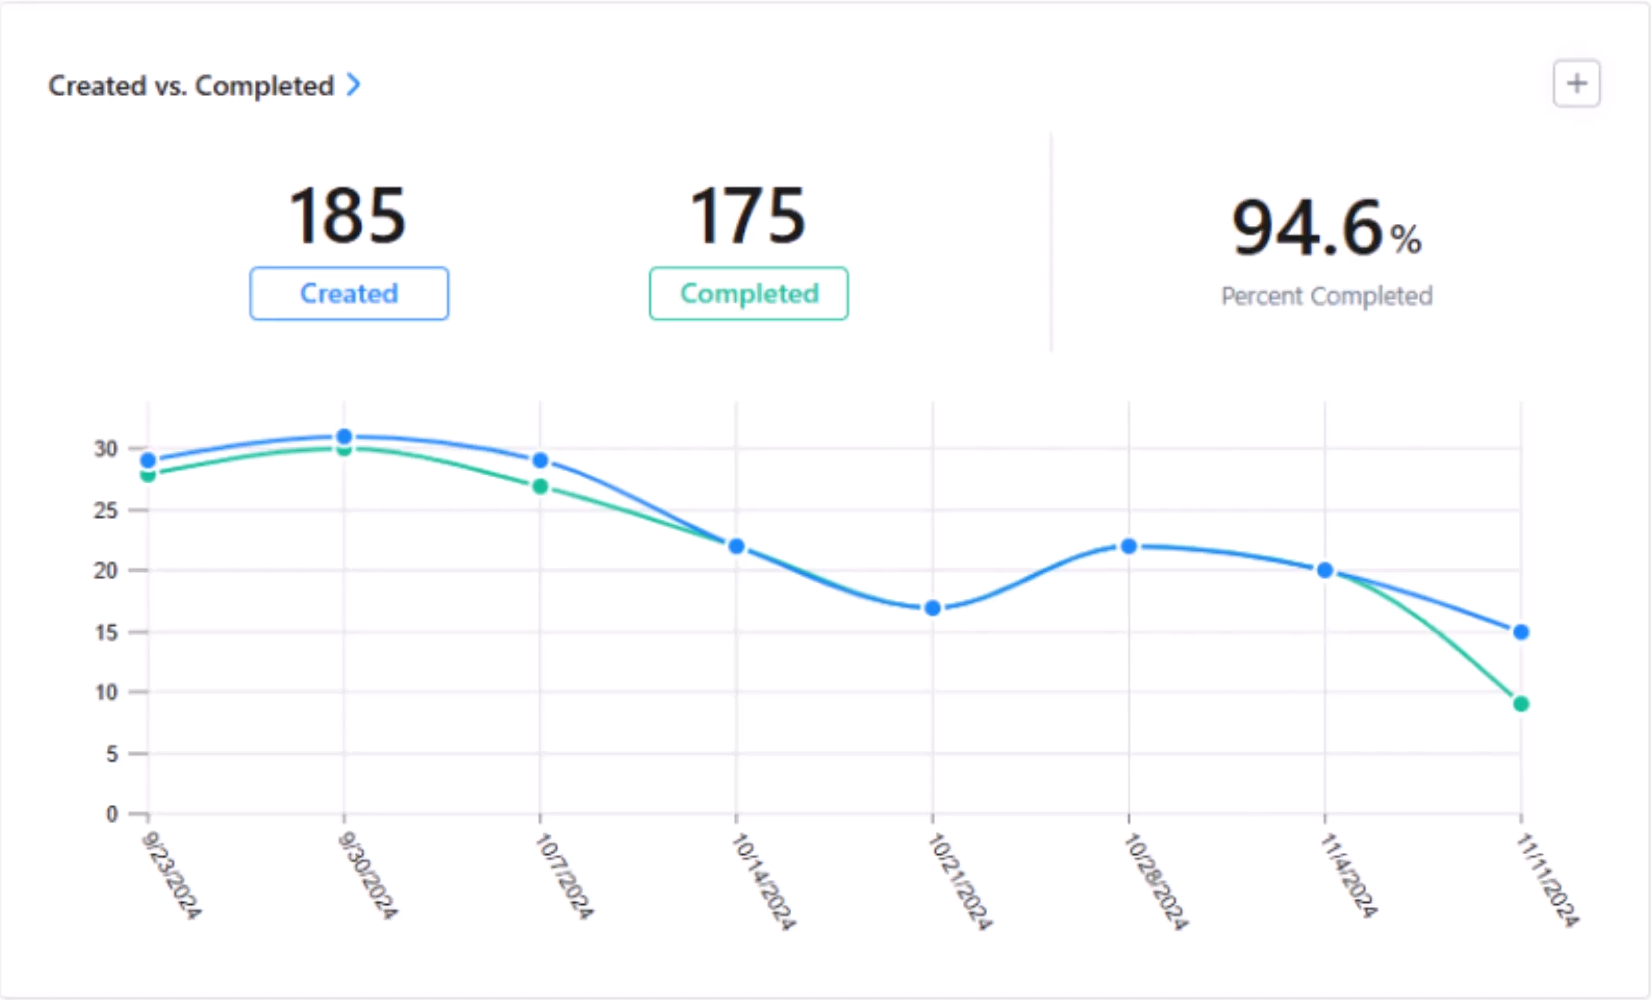
Overdue work orders
What it is: This metric can be presented visually by highlighting overdue work orders with a different color (usually red). It can also be presented as data in an “On Time vs. Overdue” chart.
What it tells you: However it’s presented, this KPI draws attention to work orders that need attention. This is great for compliance—until a work order is addressed, it will stay in sight.
Backlog trend
What it is: This KPI shows how your maintenance backlog changes over time.
What it tells you: While some amount of backlog is normal and expected, if it’s continuously trending upward, you have a problem. You may need to revisit how you prioritize and assign work orders.
Efficiency indicators
Mean time to repair (MTTR)
What it is: MTTR shows, on average, how long your maintenance team takes to complete repairs.
What it tells you: A lower MTTR means lower maintenance costs and less downtime. Seeing a visual representation of how this metric is trending over time can help keep efficiency and preventive measures top of mind.
Mean time between failures (MTBF)
What it is: MTBF can be segmented by facility, asset group, or specific asset. It tells you the average uptime between two failure states.
What it tells you: It helps anticipate when the next failure might occur. On a work order dashboard, showing MTBF can help flag when a certain asset or system’s maintenance schedule might need tweaking.
First-time fix rates
What it is: A measure of the number of repairs completed successfully on a technician’s first visit.
What it tells you: This metric is an excellent clue into how effective your work orders are. A clear, context-rich work order that’s assigned to the right technician should be successfully completed on a first try. If not, something needs to change.
Resource utilization KPIs
Technician productivity
What it is: Productive maintenance hours over total maintenance hours.
What it tells you: This metric tells you how much work your technicians are completing during their work hours. If it’s low, it might be time to identify and remove bottlenecks or overhaul how you assign work orders to technicians.
Parts inventory levels
What it is: A visual representation of inventory levels for specific machine parts.
What it tells you: At a glance, this tells you when it’s time to order new parts for critical assets. No one wants to be caught without a part they need in the event of a breakdown.
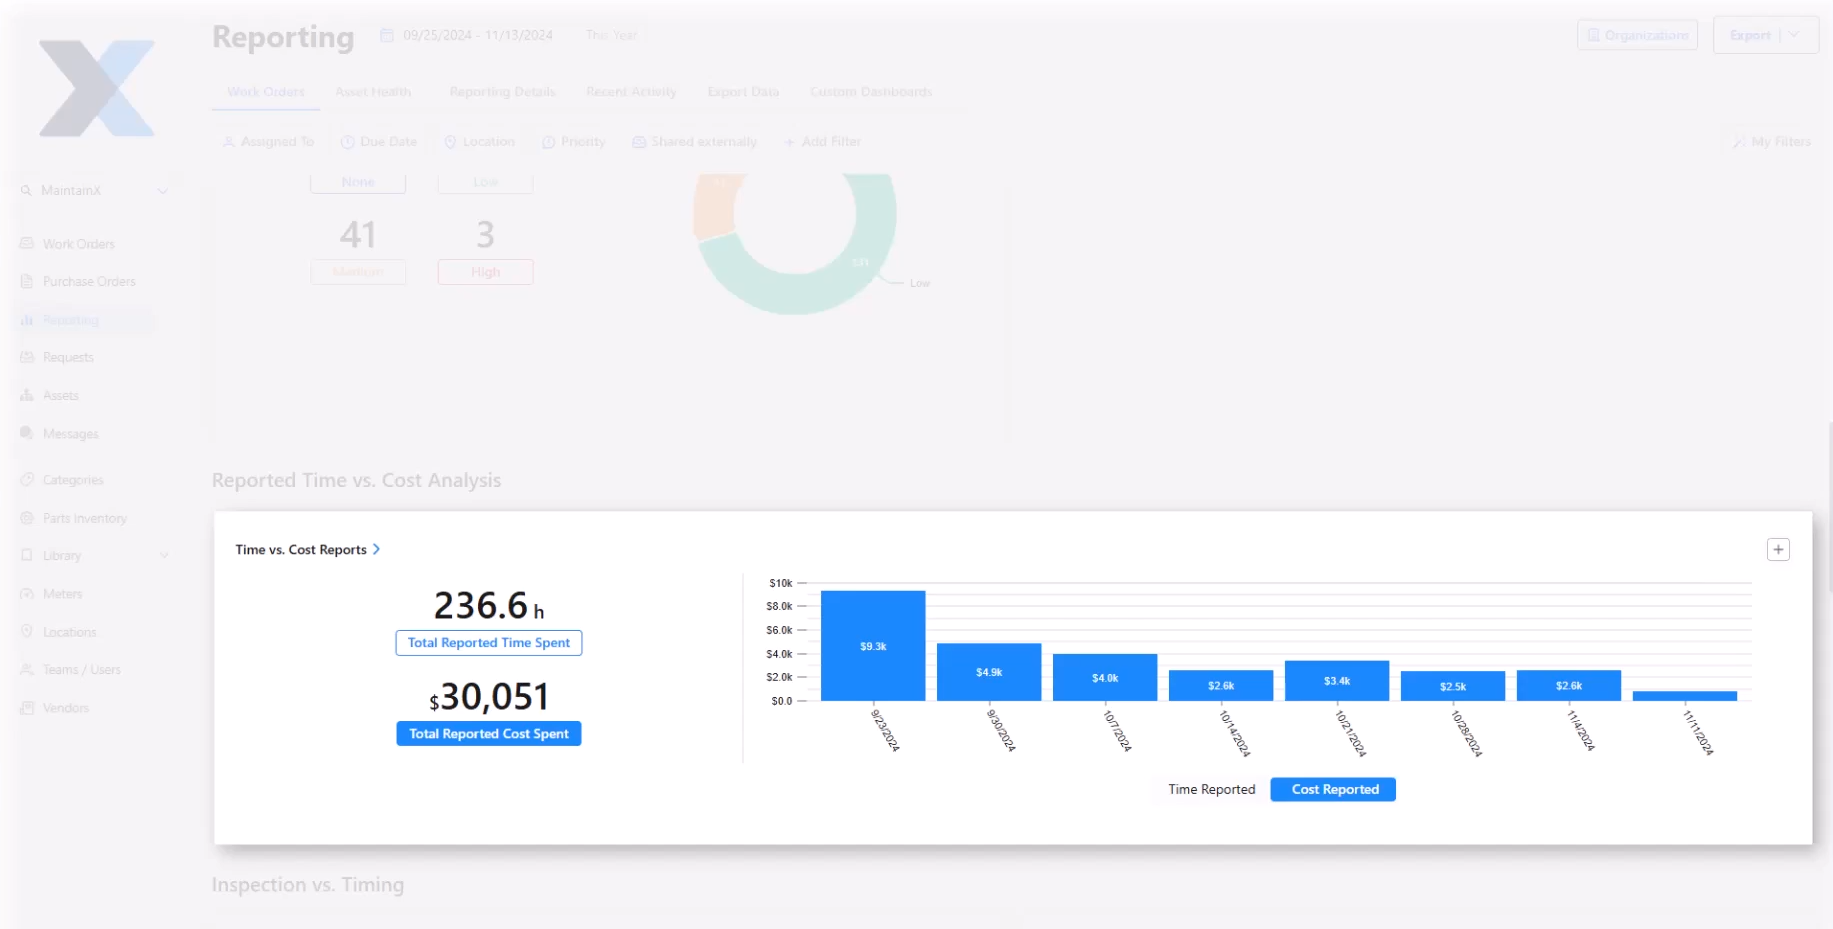
Labor cost per work order
What it is: A visual representation of labor cost for each work order (or work order type).
What it tells you: As the old saying goes, time is money. Work orders that are spiking labor costs can be investigated and tweaked as necessary. Are the work order instructions clear? Is the procedure unnecessarily complicated? Both of these factors can impact labor costs.
Maintenance strategy balance metrics
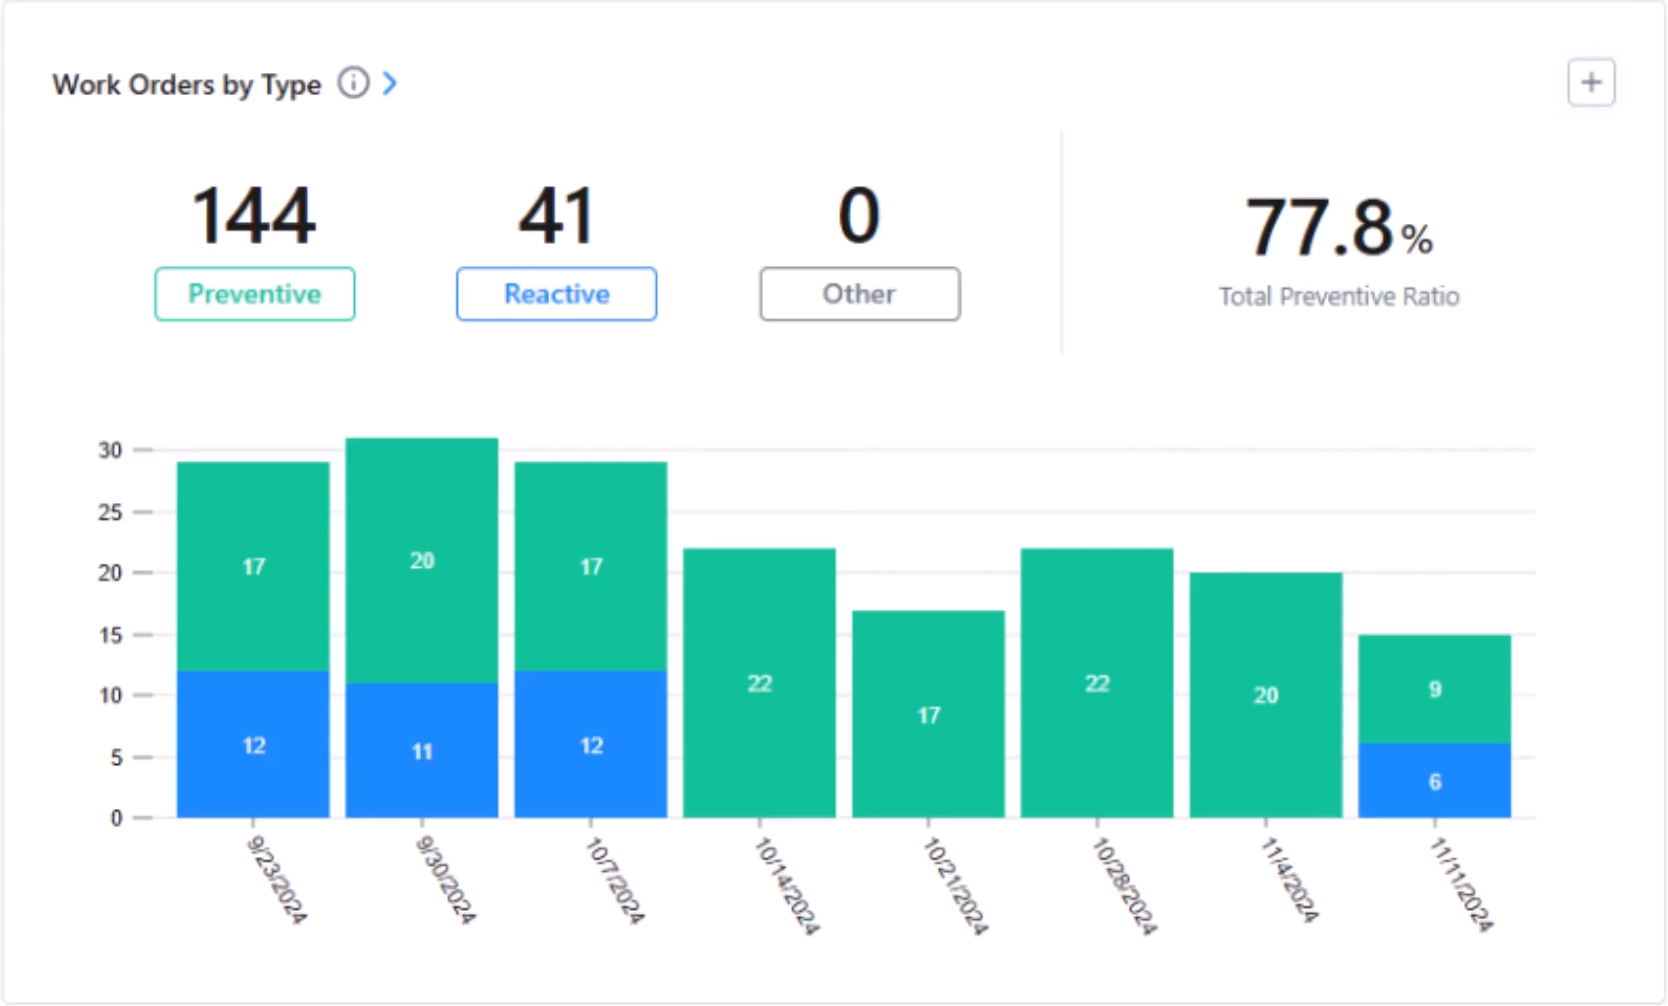
Preventive vs. reactive work ratio
What it is: A visual representation of preventive work orders compared to reactive work orders.
What it tells you: The meaning of this ratio changes depending on how you’re looking at it. Zooming out, it can tell you how well your maintenance strategy is performing. Asset by asset it can tell you whether a critical piece of equipment needs to be replaced or given a new maintenance schedule.
Planned maintenance percentage
What it is: How much of your maintenance work is scheduled rather than reactive.
What it tells you: Most maintenance organizations are aiming for a high PMP. If it’s flagging, you can drill down by asset to see which factors may be causing more breakdowns than usual.
How to customize work order dashboards
We’ve been talking about a work order dashboard in the singular sense, but you can create any number of custom work order dashboards.
Different roles within a company will need different information to get the most out of a work order dashboard. Let’s break it down role by role.
Frontline workers need a role-based dashboard view
Providing your frontline workers with a mobile CMMS that includes a personalized dashboard can be a huge productivity booster. Your technicians can simply log in, see what’s waiting for them that day, and get started on their tasks. With the right CMMS, this dashboard will be automated and updated throughout the day.
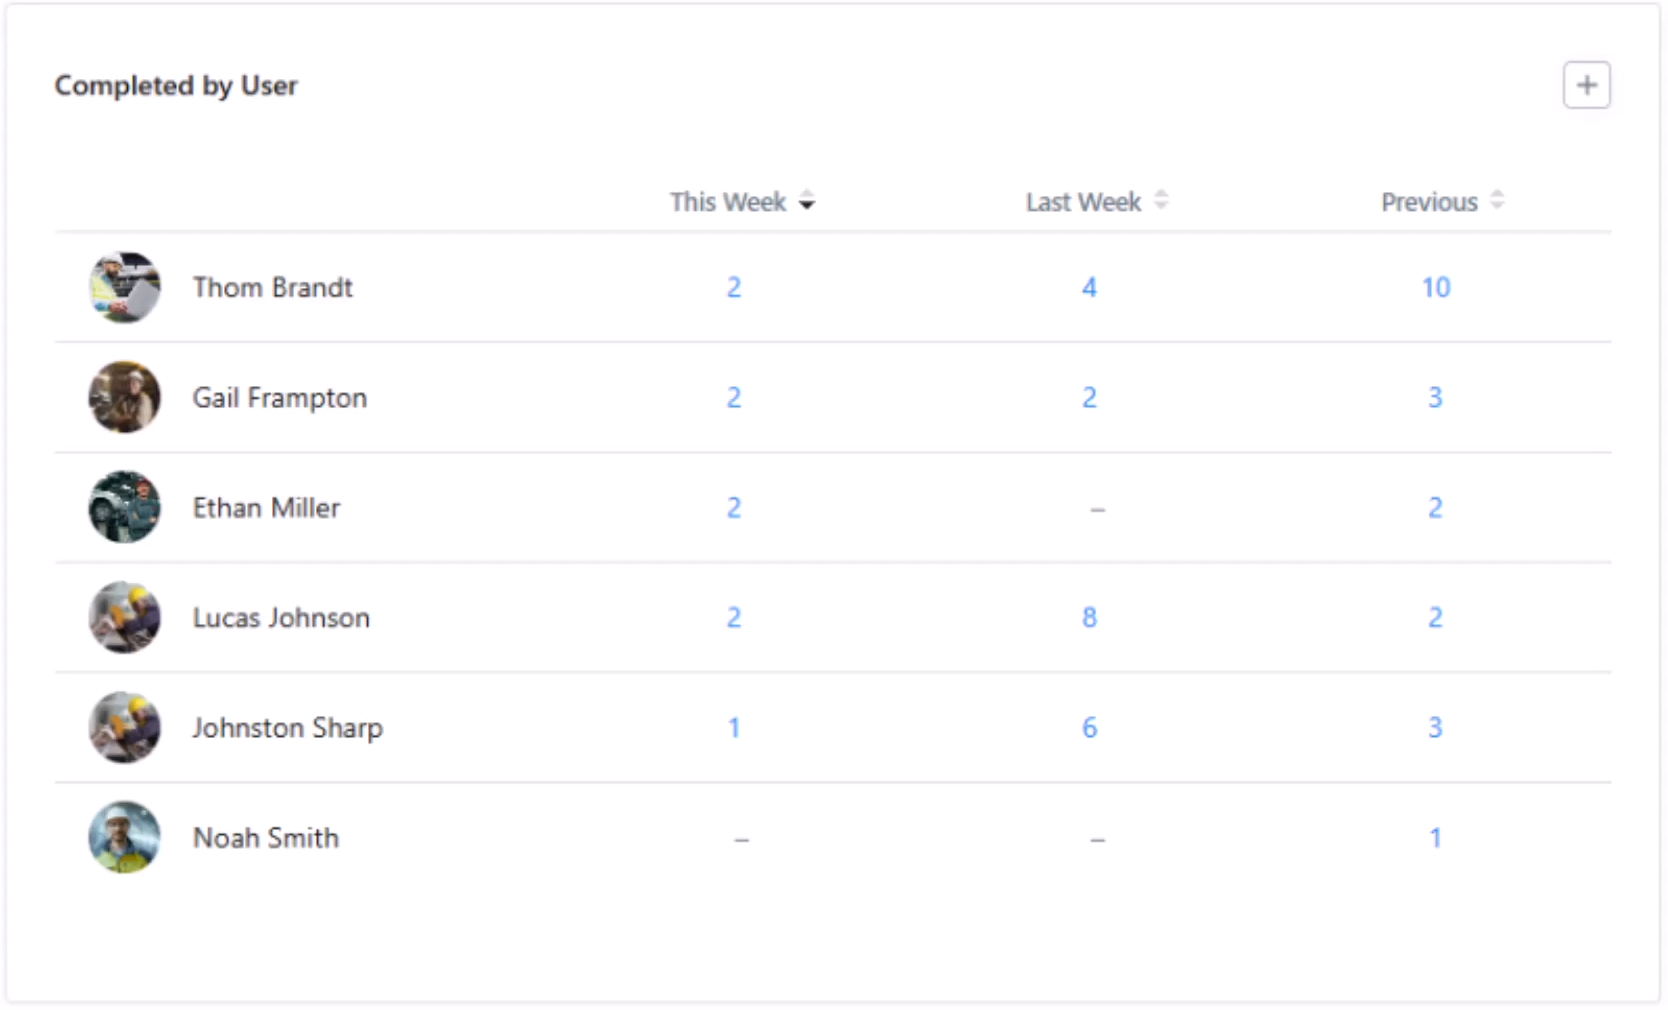
The shop floor needs a little friendly competition
A work order dashboard is a great thing for individuals, but it can also motivate a group of technicians when it’s customized correctly.
Displaying your team’s week-over-week work order completion on a shop floor monitor can be a great way to keep the frontline committed to continuous improvement. Not only is it always visible, but you can also easily refer to it during weekly meetings to discuss what went well and what could be improved in future weeks.
Managers need the ability to dive deep on site, worker, and asset metrics
Maintenance managers are the main work order dashboard engineers in any organization. Most of them will create multiple work order dashboards to dig into comparisons by worker, maintenance type, asset, site, week, month, or year.
It should be easy to both create a new dashboard and customize it quickly to show relevant information. In MaintainX, you can easily create a custom dashboard by picking any data card from the Summary screen and clicking “Add to Dashboard”.
Executives, senior leaders, and other departments need a clean summary
While maintenance managers tend to get into the weeds of work order metrics, others outside of maintenance need the 1,000-foot view. Setting up a custom dashboard that allows them to see maintenance costs, downtime, and productivity over time can be enough to prove the ROI of your maintenance program and any ongoing improvements to it.
Final word: Work order dashboards can transform your maintenance operations
Visibility is a powerful tool for maintenance teams. Making the everyday work, cost-reducing efforts, and downtime-diminishing activities of your maintenance team known with a work order dashboard is a great way to motivate your frontline, get better as a manager, and show your executive team the strides your team is making.
Visibility also encourages continuous improvement. Processes that are made visible can be tweaked and improved upon much more easily than those that stay hidden.
If you’d like to learn more about how MaintainX can help you get started on building a work order dashboard, sign up for a free tour today.
Frequently asked questions about work order dashboards
What KPIs should manufacturing maintenance teams prioritize in their work order dashboards?
Maintenance teams can use work order dashboards to track KPIs around work order completion, efficiency, resource utilization, and maintenance strategy balance. While every maintenance team’s needs are unique, showing real-time updates to metrics like average completion time, technician productivity, or planned maintenance percentage can drive improvements over time.
How do work order dashboards help reduce unplanned downtime in industrial facilities?
Work order dashboards visualize maintenance data and put it front and center so that frontline workers, operators, and managers can all stay informed on KPIs. This way, any threats to downtime can be flagged early and avoided.
What's the difference between work order dashboards and traditional CMMS reporting?
CMMS reports show a look back at a period of time. Whether a maintenance manager is viewing reports on a daily, weekly, or monthly basis, they’re still looking at what happened in the past. Work order dashboards show what’s happening right now. While work order dashboards can include trends over time, their main purpose is to show a snapshot of what’s going on at the moment.
How often should maintenance managers review dashboard metrics for optimal facility performance?
Dashboards are meant to show what’s happening in a facility in real time. Maintenance managers can get a lot of information just by checking the dashboard a few times a day. However, maintenance managers can also compare dashboard metrics week by week to try to catch any emerging trends that need attention.
Can work order dashboards integrate with existing ERP and asset management systems?
Yes. A great work order dashboard will always be integrated with ERP and asset management systems (like a CMMS). A work order dashboard that shows live asset and resource data is showing valuable real-time context that both informs and motivates workers.
What mobile dashboard features are most important for field maintenance technicians?
Field maintenance technicians need to see the information that will help them do their job as effectively and efficiently as possible. Dashboard features like overdue work orders, current backlog, automated alerts, and work order priority can help technicians plan their day and address urgent issues.

Senior Content Writer, MaintainX


.webp)