

Maintenance teams are swimming in the data they get from work orders, work requests, equipment sensors, inventory records, and other parts of their operation. The problem is that most of this information goes unused.
This creates a frustrating situation where you’re tracking metrics, but not always turning them into insights that drive better decisions.
This is where AI makes the difference. AI tools can sift through unstructured work order notes, performance metrics, and operational data, then translate those findings into actionable insights.
Instead of drowning in spreadsheets, maintenance leaders can get answers to questions like:
- Which assets are driving the highest downtime costs?
- Where should we be doing more preventive maintenance and where can we decrease PM frequencies?
- Which sites or shifts are outperforming others, and why?
The result: decisions grounded in data, not guesswork.
In this article, you’ll learn how to set up AI tools to analyze your maintenance data and find key insights that might be hiding in your mountain of metrics.
The benefits of using AI to analyze maintenance data
Reporting is one of the most time-consuming tasks for any maintenance manager. If you’ve ever sat at your desk late on a Friday afternoon, scrolling through spreadsheets just so you can update a dashboard or create a last-minute report for your boss, you’ll be familiar with this pain. Fortunately, AI can help you solve a lot of the challenges with understanding maintenance data, which can help you:
- Make decisions faster: Leaders get instant insights, not delayed reports.
- Reduce downtime and costs: AI identifies top asset and cost drivers quickly.
- Improve visibility: Teams, sites, and shifts are compared in real time.
- Align with executives: Reports can be tailored for C-suite audiences.
- Predict failure: AI can forecast trends, not just report on history.
How to create an AI assistant to analyze maintenance data and maintenance metrics
Traditional reporting is static and time-consuming. You can spend hours building dashboards and only scratch the surface. AI allows you to go further, faster, with your maintenance data. Here is a step-by-step template for creating an AI assistant that can analyze your maintenance data and surface trends, insights, and action.
Step 1: Collect the right data
Start with metrics you already track:
- Maintenance performance metrics: downtime, MTTR (mean time to repair), MTBF (mean time between failures), maintenance costs, preventive maintenance percentage.
- Operational data: throughput, cost of goods sold, revenue per unit.
- Work order and PM details: asset, task type, technician notes.
- Company goals: KPIs and targets at team and enterprise levels
Step 2: Structure and clean the data
AI works best when inputs are standardized. Ensure:
- Consistent naming and units (e.g., all times in hours).
- Removal of duplicate or missing fields.
- Normalization of values (e.g., cost per asset type).
- Segmentation filters (e.g., by site, asset class, or shift)
Step 3: Create the right prompts for analyzing maintenance data
Here are some tips to keep in mind when designing prompts to analyze maintenance data:
- Specify which metrics to analyze.
- Example: Analyze mean time to repair and costs.
- Add a time frame for analysis.
- Example: Look at data from the last six months from all sites.
- Provide context or comparisons.
- Example: Compare performance between Site A and Site B
- Define the audience or purpose.
- Example: Summarize business impact for executives.
- Ask for a specific format for outputs.
- Example: Provide a bulleted list of site-level trends and recommended actions.
Here are some sample prompts to use as a starting point for your interactions with AI:
- “Analyze our data on downtime and maintenance costs for the last 12 months. Tell me what trends you see, including notable patterns in asset groups. Provide analysis in this structure: Observation, insight, and recommended action. Prioritize by effort, impact, and feasibility.”
- “Summarize the top three anomalies in maintenance performance this month. Include what changed, why it might ’ve happened, and what I should look into first.”
- “Give me a short briefing I can share in the Monday toolbox talk. Focus on key metrics that improved and/or declined, with suggested talking points for each.”
- “List any sites or shifts that outperformed the average in [METRIC] this week. What practices might be worth replicating at other sites?”
- “I’m presenting to the executive team. Summarize maintenance performance using the following metrics: [METRICS]. Translate this into a concise narrative that ties maintenance performance to [COMPANY TARGET].”
Step 4: Analyze at scale
Once structured, AI can identify:
- Asset groups that consistently underperform.
- Shifts or sites that achieve higher PM compliance.
- Cost drivers that contribute most to downtime.
- Trends over time, such as improvement or decline in performance metrics.


An example of using AI to analyze maintenance data
A leader asked AI to review downtime, preventive maintenance percentage, and maintenance costs over 12 months. The AI produced:
- Observation: Downtime dropped ~17 hrs/month; costs down ~$2.8k/month.
- Insight: Injection Molding was the top downtime driver (~328 hrs/month, ~$208k/month). Plant B was the highest downtime hotspot.
- Action: Standardize PM best practices, run a 6-week reliability sprint, focus on tuning PM effectiveness.
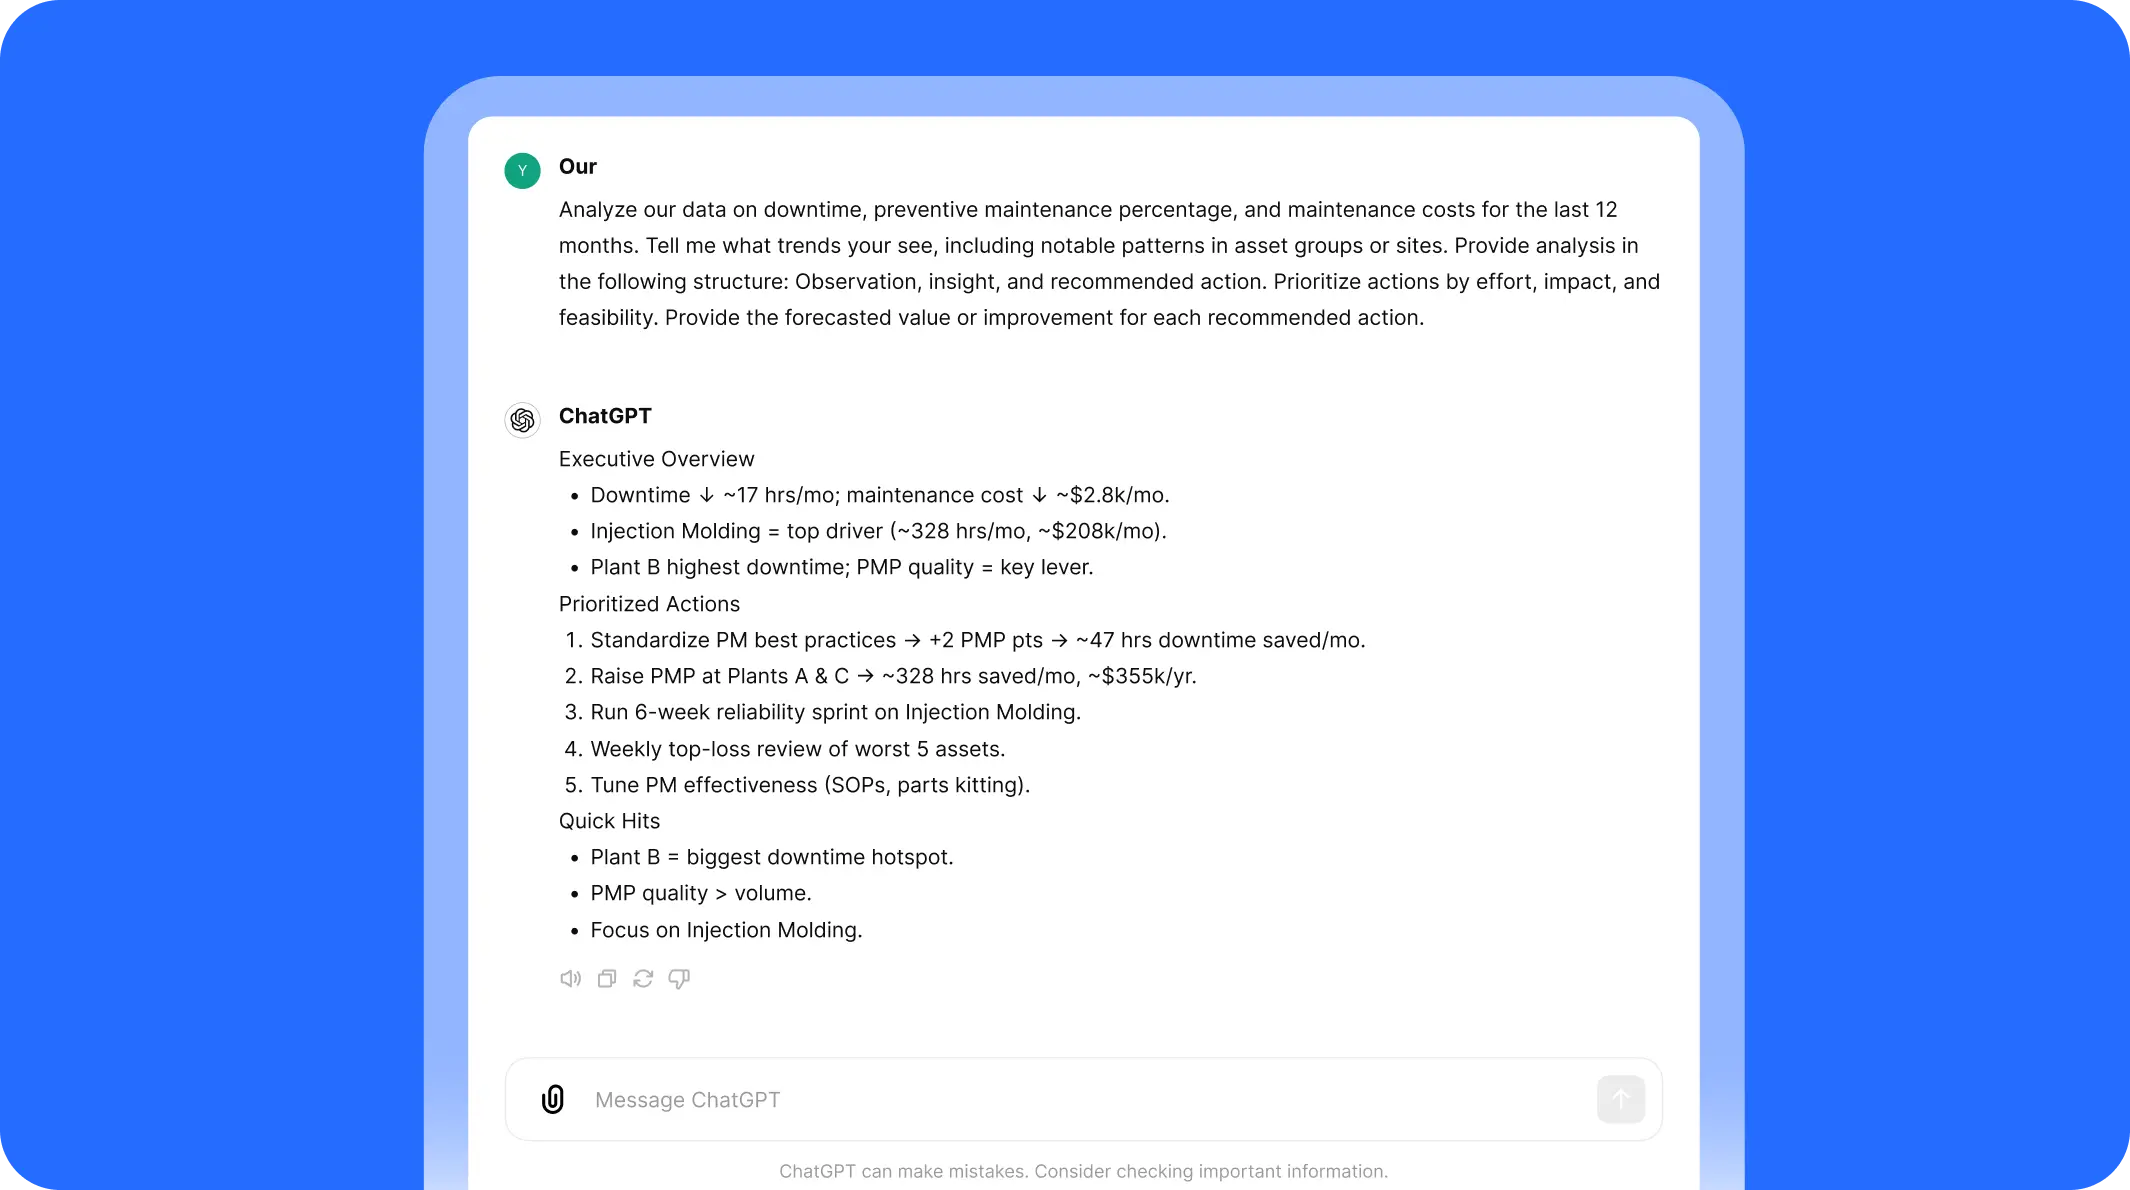
This is analysis at the level of an operations consultant—delivered instantly.
How to use the analysis that AI gives you
AI is powerful, but its value comes from action. Leaders should:
- Refine PM schedules: Use insights to adjust frequency, task lists, and resource allocation.
- Build better business cases: Translate downtime costs into ROI for new projects or staffing.
- Enhance reporting cadence: Automate weekly, monthly, or quarterly reports.
- Identify training opportunities: If one site outperforms others, replicate best practices.
- Spot data gaps: If AI highlights missing information, improve work order forms and technician note capture.
How to measure the impact of AI in maintenance
Track these metrics to gauge the value of AI-driven data analysis:
- Improved KPIs: MTTR, downtime hours, PM compliance.
- Reporting time saved: Hours reduced in preparing dashboards or presentations.
- Visibility across sites: Better cross-comparison of performance.
- Resource allocation efficiency: More accurate use of labor, parts, and schedules.
The challenges of using AI to analyze maintenance data and how to solve them
- Data silos: Metrics are often spread across CMMS, ERP, and BI tools. Look into integrating platforms so data flows between them.
- Inconsistent inputs: Missing notes or incorrect codes weaken analysis. Solve this problem by standardizing forms and making notes mandatory.
- Resistance to change: Technicians may doubt the value of entering detailed data. Focus on showing how their inputs drive improvements.
- Over-reliance on AI: AI outputs aren’t always accurate. Always validate outputs and treat AI as an advisor, not the end of the conversation.
Six more ways to use AI in maintenance
There are hundreds of maintenance teams using AI in their day-to-day tasks to help them work faster, reduce downtime, and eliminate obstacles. This includes:
- Building AI assistants for real-time repair support
- Creating standardized SOPs and procedures
- Detecting anomalies in equipment
- Forecasting parts usage
- Conducting root cause analyses
- Collecting and actioning team knowledge
For a complete playbook on how to adopt these AI use cases, download the Maintenance Manager’s Quick Start Guide to AI, which includes templates and step-by-step instructions for building your own AI program.
Where to Go from Here
AI-powered data analysis helps maintenance leaders move from reactive reporting to proactive strategy. With instant insights into downtime, costs, and compliance, leaders can make smarter decisions, faster.
MaintainX CoPilot makes this simple by embedding AI into your CMMS workflows. You can:
- Ask questions in plain language.
- Generate executive-ready reports in seconds.
- Identify hotspots, trends, and anomalies automatically.
- Share insights across sites and teams.
With AI maintenance analytics, your data stops being a burden—and starts becoming your most valuable asset.

The MaintainX team is made up of maintenance and manufacturing experts. They’re here to share industry knowledge, explain product features, and help workers get more done with MaintainX!
.webp)


.webp)