Key takeaways
- Most maintenance teams are sitting on valuable data in work orders, manuals, inspections, and reports. The challenge is using it, not collecting more.
- The real gains come from structuring and standardizing maintenance data, making it searchable and mobile friendly, and slicing it by asset, type, and shift to drive clear decisions.
- Layering in tools like QR codes, automation, and AI turns everyday maintenance data into faster troubleshooting, better inspections, and stronger evidence for improving reliability.
A recent episode of The Wrench Factor asked an important question: what are manufacturers doing wrong with their data? Throughout their conversation, Jake Hall (The Manufacturing Millennial) and Remus Pop from Concept Reply kept returning to one simple fact: There’s more data available to manufacturers than ever, but most are only using a tiny fraction of it.
As Remus explains, “Five to 10 years ago, we were focused on how to connect the factory.” Now that everything’s connected, manufacturers are asking a different question: “What do we do with all this information?”
Let’s take a look at some easy ways your maintenance team can get more value from the data it’s probably already collecting or has on hand.
Work order notes
Data to look for
Look for troubleshooting steps, fixes, or parts that aren’t part of an official procedure. Your technicians probably have years, if not decades, of experience with equipment at your facility. They know all the quirks of each machine and what works to get it up and running again—even if it’s not part of the official procedure or checklist. This qualitative data won’t show up on dashboards or spreadsheets, but it’s incredibly valuable.
How to use the data
Update your maintenance procedures and troubleshooting guides to include the common workarounds and additional steps used by technicians. Not only will this allow other technicians to repair equipment quicker, but it will lead to better knowledge retention and faster onboarding as new employees join your team.
How to improve the data
The first step would be to make work order notes mandatory before work can be closed off. The next would be to add an extra field within the notes section that allows technicians to specify if they did any troubleshooting or repair tasks outside the normal procedure or checklists. The final evolution would be to use voice-to-text to capture work order notes, and then use AI to summarize those notes and give a detailed breakdown of the actions taken by the technicians, including any workaround or extra steps not represented in the usual procedure. That might look something like this:
.gif)
Digital asset manuals and past work orders
Data to look for
Equipment manuals and past work orders contain almost every piece of data technicians need to conduct an inspection or complete a repair. That includes safety procedures, checklists, and common failure codes (plus their fixes), and a bill of materials. Quick access to this data can mean getting an asset running in 30 minutes instead of 60. Multiply that by hundreds of tasks, and it could equal millions of dollars of extra production capacity.
Extracting this data from these resources is the key to increased technician efficiency. Collect common procedures, safety guidelines, troubleshooting techniques, failure codes and fixes, and BOMs.
How to use the data
The best way to make this data available to technicians quickly is to make it accessible on mobile devices in a way that’s easy to search through. One of the best ways to achieve this is through QR codes. Attaching QR codes to assets that contain manuals, past work orders, and safety tasks allows technicians to get all the information they need without going back and forth to an office or searching through massive manuals and guessing which instructions fit the scenario.
It’s essential to organize the information you provide via QR codes to highlight the most commonly used and important details or you risk overwhelming technicians and cancelling out any benefits.
How to improve the data
Improving this data means improving its searchability. In other words, how do technicians not only access the data quickly, but find the right procedure, part, or other detail within the full documents?
One way to do that is to employ AI within whatever system your technicians use to access this information. AI is great at searching through documents and data, especially if you limit its search radius to only the documents and data you provide.
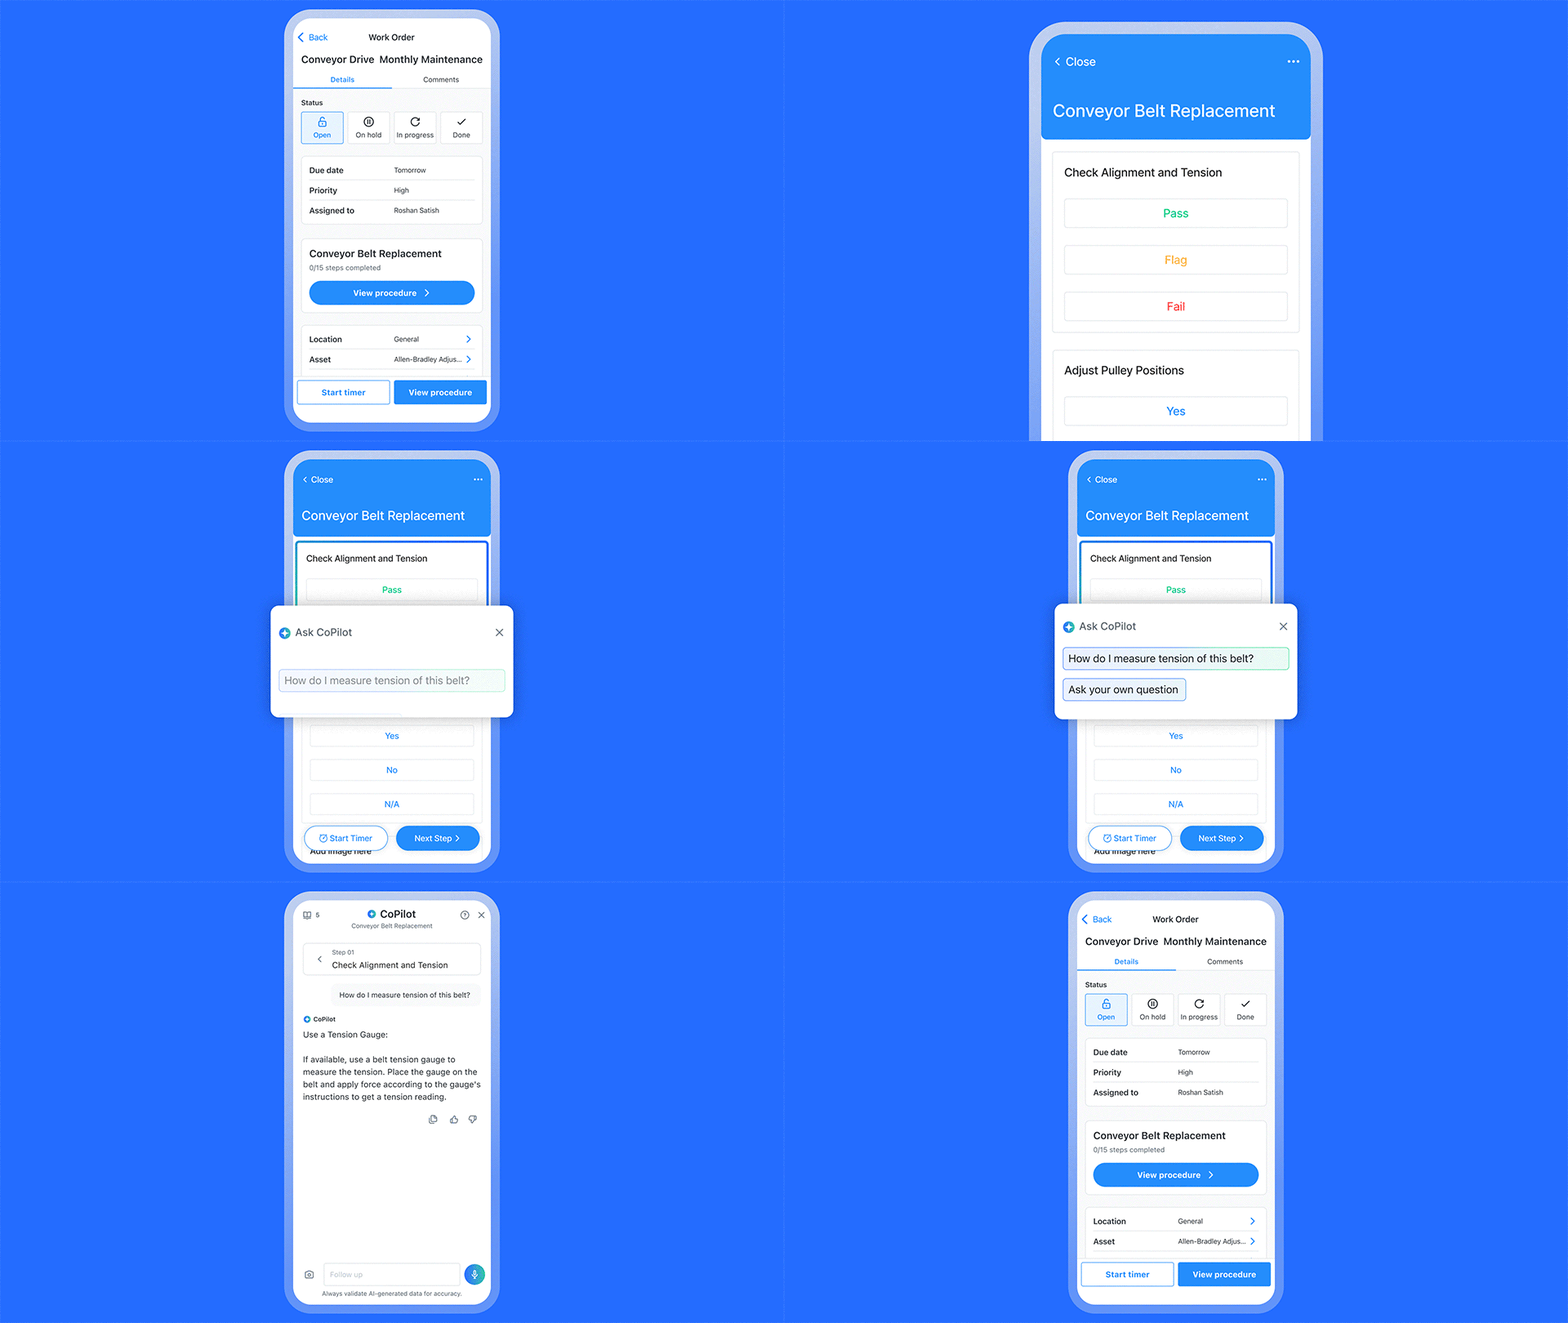
Here’s an example of how an AI assistant can help a technician quickly search through an equipment manual to find the right procedure:

Response times
Data to look for
Start with the basic timestamps in your CMMS or other maintenance system, specifically for reactive work, including:
- When the work order was created
- When it was approved (if applicable)
- When it was assigned to a technician
- When the technician acknowledged it
- When work actually started
The core metric is the time between assignment and work started. That is your true response time. From there, layer in context so the numbers actually mean something:
- Priority level (emergency, high, medium, low)
- Asset or asset class (critical production line versus support equipment)
- Location (line, building, or site)
- Shift and day of week
- Source of request (radio call, phone, digital request form)
- Who the work was assigned to (team, trade, or individual technician)
You want to be able to find trends in response times, like assets/asset groups, shifts, time of day, mode of request, or reasons for the delay.
How to use the data
Response time data is best used to reveal bottlenecks in your maintenance workflows and fix them. A few practical examples include:
- Set realistic benchmarks for your team. Use historical data to define response time targets for each priority level. For example, emergencies require a response within 10 minutes, while medium-priority work requires a response time of four hours.
- Spot bottlenecks in the process. If the time from request to assignment is long, the bottleneck is probably in approval or dispatch. If assignment is quick but technicians start work much later, the constraint is technician availability, parts, or clarity of the request. The timestamps tell you where to focus.
- Align staffing and on-call coverage. Slice response times by hour of day and day of week. If response times explode on Friday nights or during a particular shift, you can justify changing schedules, adding cross trained coverage, or adjusting on-call rotations.
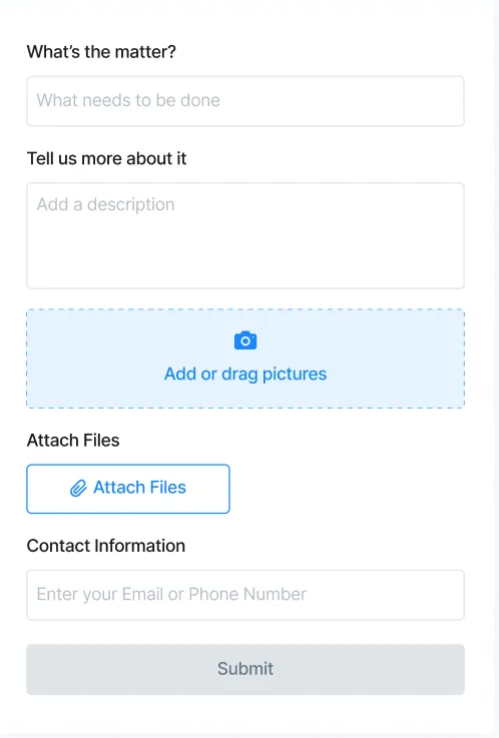
- Improve request quality. Long response times sometimes come from technicians needing to call back the requester for more details. If you see many delayed starts tied to vague requests, update your request forms to fill key gaps in information, like this:

How to improve the data
You cannot improve what you cannot trust. That’s why the first step is to make response time data accurate and consistent.
- Define exactly what ‘start’ means. Write a clear definition. For example, “Response time stops when the technician arrives at the asset and begins troubleshooting.”
- Standardize how starts are recorded. Ideally, technicians tap a “Start work” button or change the work order status on a mobile device when they begin. Make timestamps mandatory for any work order.
- Limit status options. Too many vague statuses make data messy. Use a small, meaningful set such as: New, Assigned, In progress, Waiting on parts, Waiting on production, Complete.
- Encourage real time updates. Make it easy for technicians to update statuses from the floor using mobile devices, not from a desktop at the end of the day.
- Use automation as a safety net. Configure your system to trigger alerts when a work order has been assigned but not started within a certain time.
Failed inspections
Data to look for
This data point is a rate case where failure can be a good thing. Failed inspections lead to corrective and preventive actions instead of downtime and reactive maintenance. But there’s also a lot you can understand about assets and your maintenance program by looking at failed inspections in the aggregate.
Start by defining what a ‘failed inspection’ means for your team. In most plants, it is either:
- An inspection where the overall inspection is marked as ‘failed’
- Any inspection where at least one task is marked as ‘failed’ and requires follow up work
Once that is clear, focus on collecting failed inspections and failed inspection rate (total failed inspections as a percentage of all inspections) by:
- Maintenance type
- Asset/Asset class/Line
- Area/Site
- Failure type
- Severity/Criticality
How to use the data
Failed inspection data can tell you a lot about your assets and the effectiveness of your maintenance program, which you can use to:
- Identify bad actor assets and components: Rank assets and components by failed inspection rate. The ones at the top are likely driving a lot of downtime, quality issues, safety risk, and/or maintenance costs. Use that list to prioritize efforts to find long-term fixes.
- Optimize inspection frequency: If failure rates are low or zero, you’re probably over inspecting. This should trigger an evaluation of the preventive maintenance schedule of this asset and a possible reduced inspection schedule. If certain checks fail often, you may need to increase the frequency of PMs.
- Differentiate ‘good failures’ from ‘bad failures’: A ‘good’ failure is when an inspection finds an issue early, and corrective work is completed before it affects production or safety. A ‘bad’ failure is when the same issue shows up inspection after inspection, or when the asset breaks down shortly after passing an inspection. This list will help you reduce pencil whipping, build better training materials, assign the best technicians for certain jobs, and show how maintenance is helping improve production capacity.
How to improve the data
Better data on failed inspections starts with clarity and structure. If everyone knows exactly when to mark a failure, and the system captures that consistently, your analysis will be far more useful.
- Make pass or fail criteria unambiguous: Rewrite checklist items so it is obvious what counts as a pass or fail. For example, “Belt deflection within X–Y millimeters” is easier to judge than “Check belt tension.” If you want to go even further, embedding AI into the workflow can help technicians get the exact instructions for inspecting a component so you’re always sure that a pass or fail is accurate. For example:

- Standardize failure categories and codes: Do not rely only on free text comments for inspections. Add required fields and a predefined list for failure type, root cause category, component, and severity.
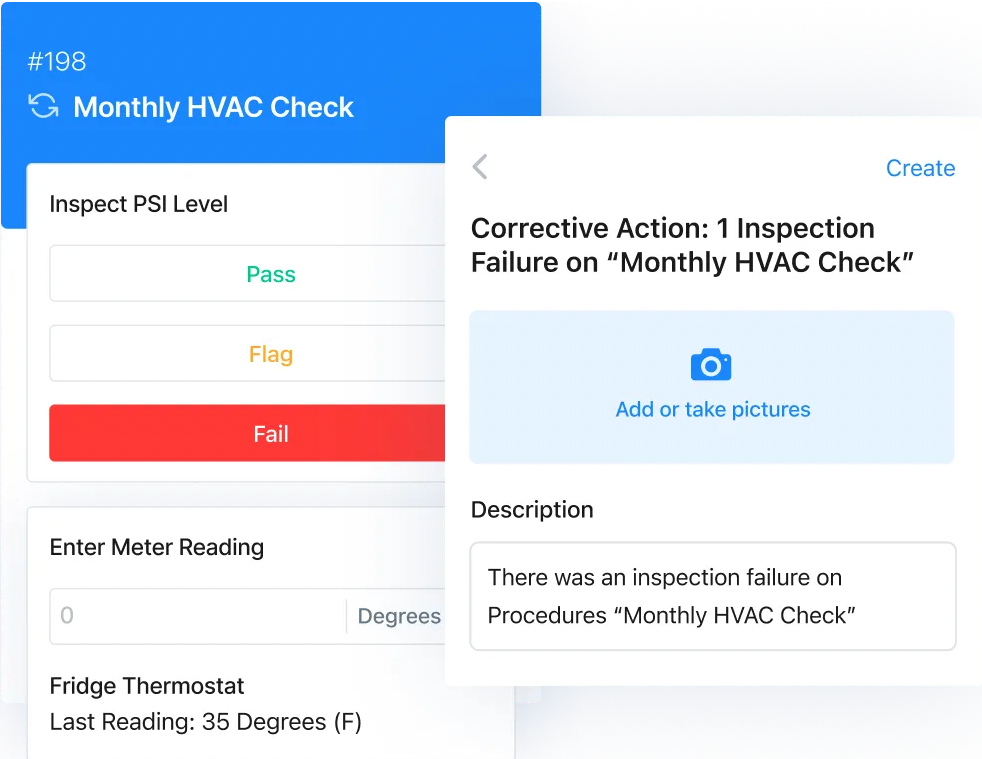
- Link every failed item to a follow up action: Configure your system so that any failed inspection automatically creates a corrective work order is documented with a clear justification for why no action is needed. For example:

- Require evidence for failures: For any failed inspection, make it mandatory to add notes, a photo or video, and/or a meter reading. This extra context improves both the quality of future analysis and the efficiency of the technician doing the corrective work.
Reports and dashboards
Data to look for
Not every maintenance team has in-depth dashboards that analyze every maintenance KPI. But most have at least a simple report with maintenance metrics they track regularly. These reports are full of information and insights that don’t just show past performance, but can lead to future action.
Start with the KPIs you already put on dashboards or in regular reports, even if it’s only two or three basic metrics. This might include:
- Downtime
- Mean time to repair (MTTR) and mean time before failure (MTBF)
- Planned maintenance percentage
- PM compliance
- Backlog size/age
Then make sure each KPI can be broken down by a few simple dimensions:
- Asset, asset class, line
- Area or site
- Shift
- Work type (preventive, corrective, emergency)
How to use the data
The goal is to turn familiar dashboards into decisions, not just status updates.
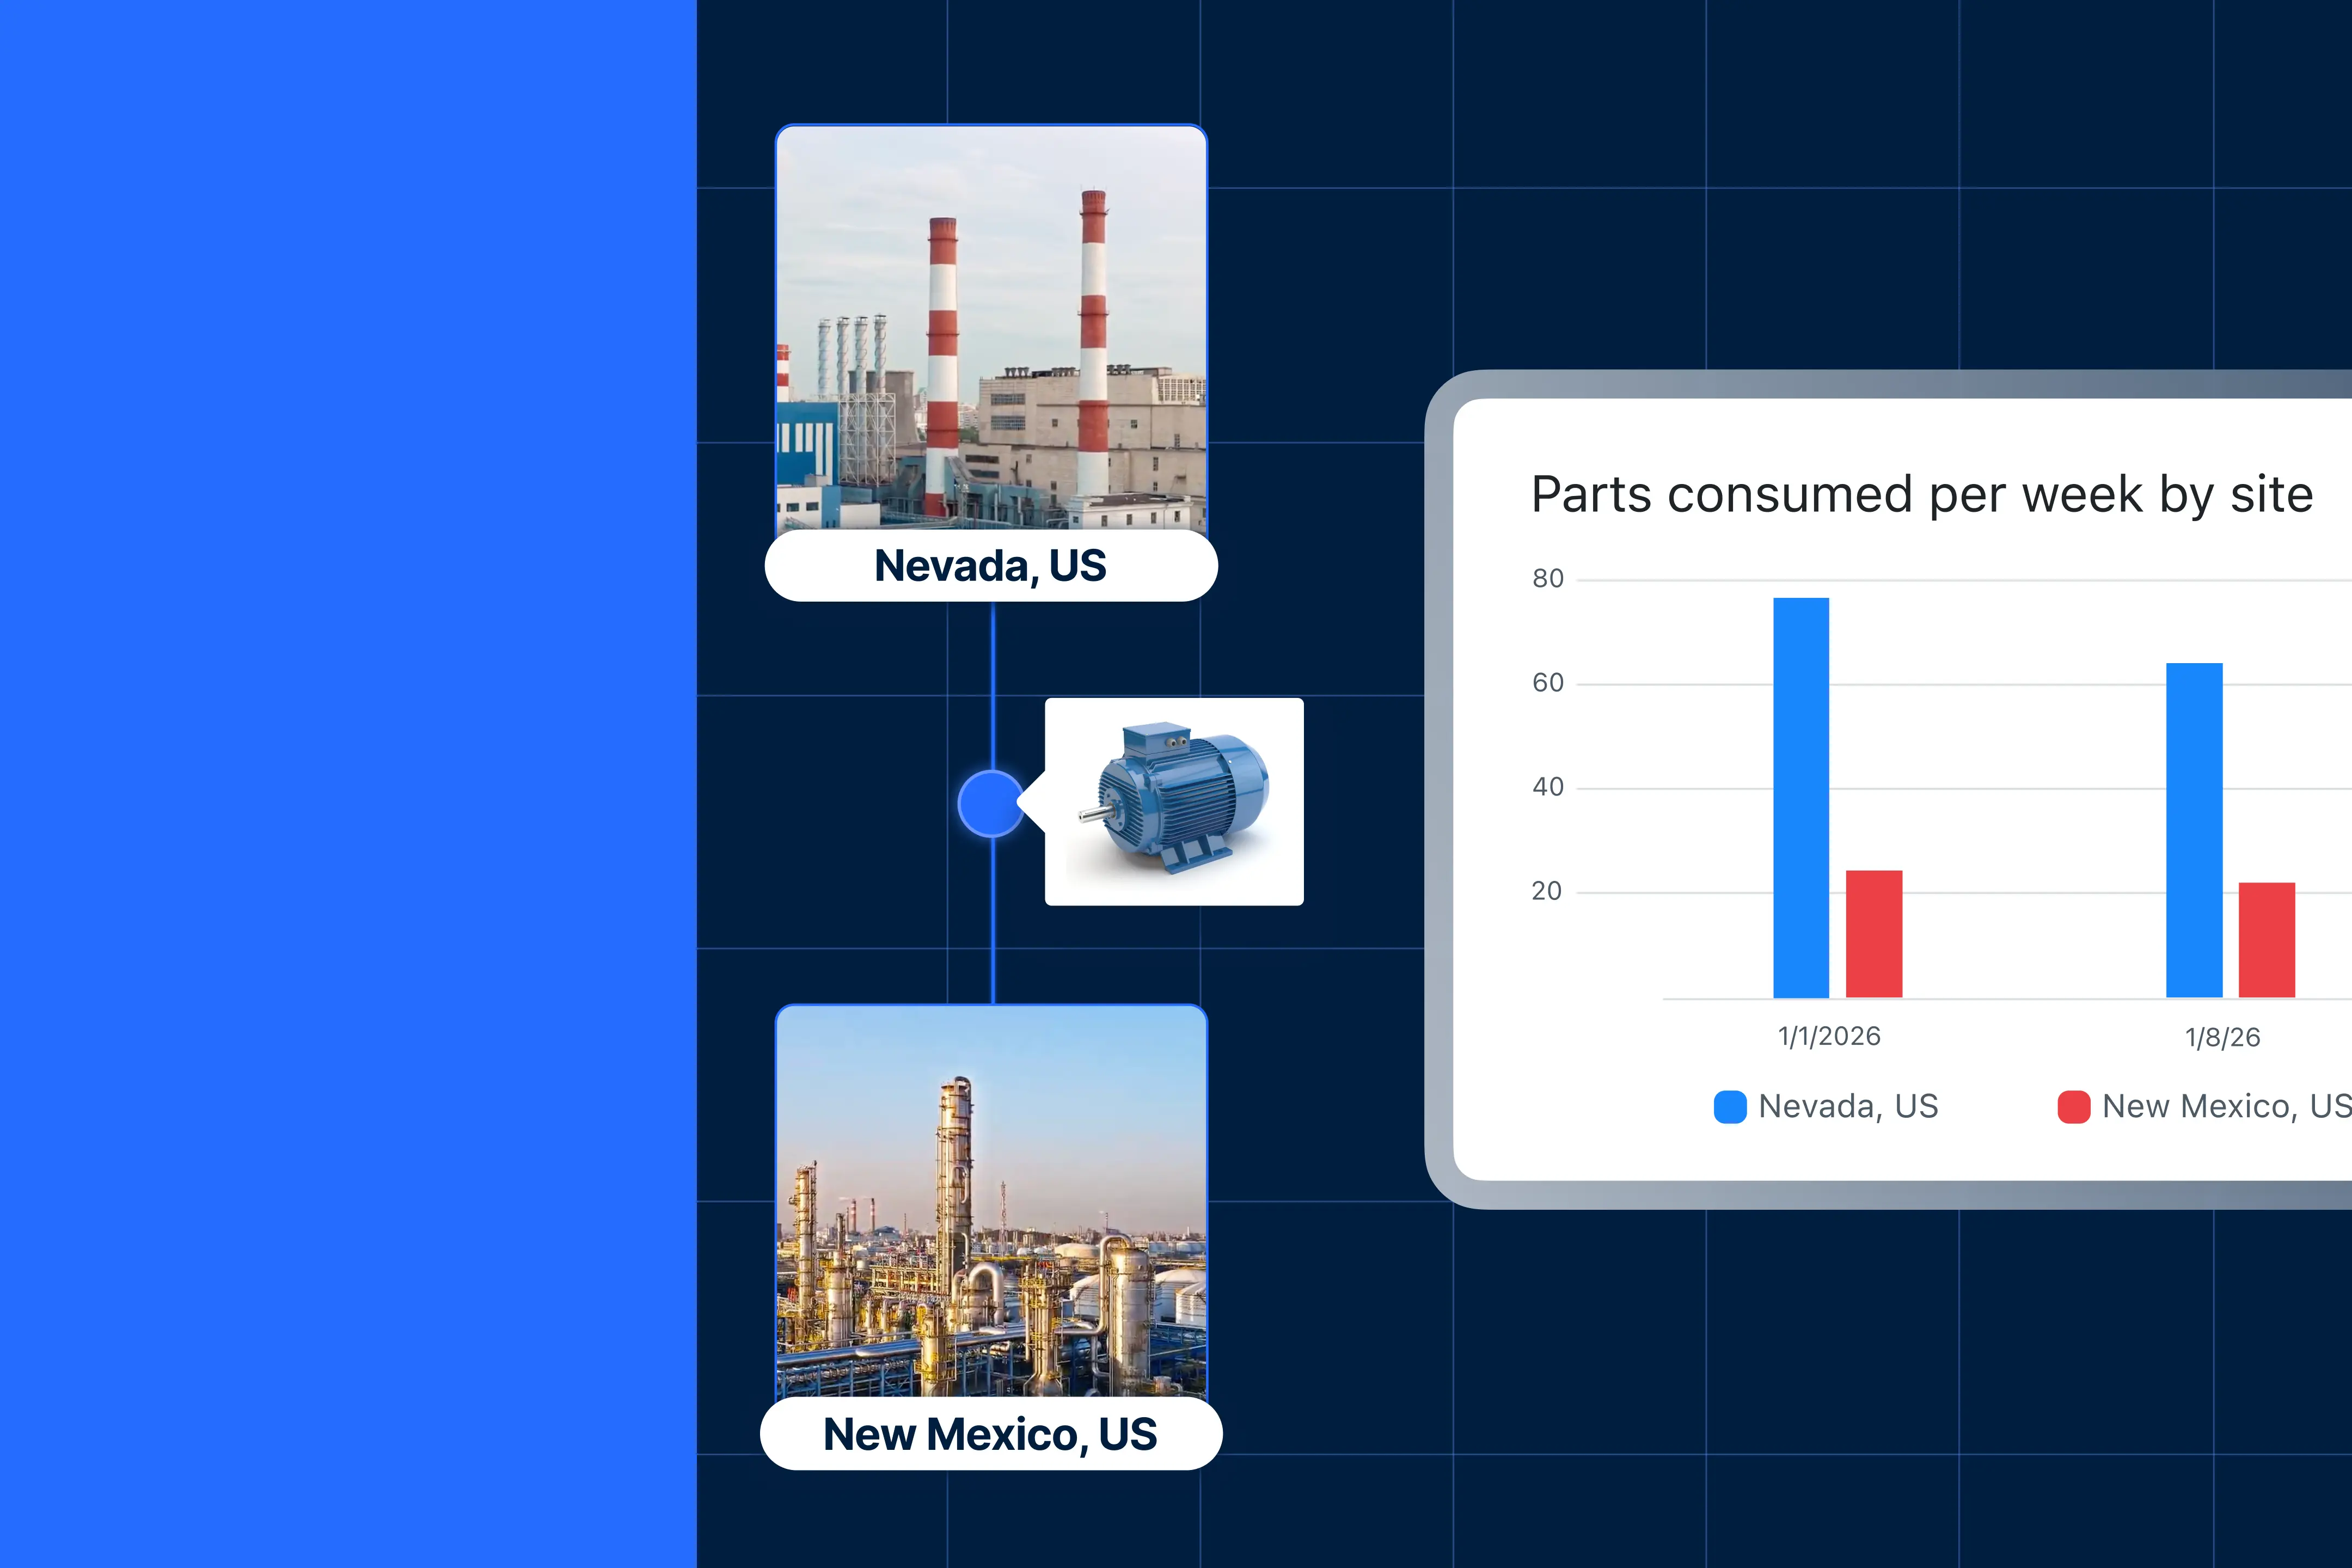
- Segment your KPIs: Slice each KPI by asset, site, or type of maintenance to find assets or workflows that can be improved to reduce downtime and costs.
- Combine related metrics: For example, look at downtime together with MTBF and MTTR for the same asset. High downtime plus low MTBF and high MTTR tells you where to focus reliability and improvement work.
- Make role-specific reports: Divvy up the metrics and have them tell a story for different stakeholders at your facility. For example, you can put together a simple list of bad actors for technicians. For supervisors, you can make a report for each line or shift to guide training and scheduling. And if you want to show the value of maintenance to senior leaders, create a short list of high impact assets or projects tied to production or safety.
How to improve the data
One way to elevate your data is to use AI to assist you in analyzing the reports you’re already putting together. This cuts down the time it takes to sort through the numbers, and brings you right to the part where you can find insights and make decisions based on them. Here’s an example of how AI can help you here:
.gif)
Getting the most from your maintenance data: Start with the data you already have
You do not need a massive digital transformation project to get more value from maintenance data. You just need to unlock the information you already capture every day.
When you treat work order notes, manuals, timestamps, inspections, and KPI reports as strategic assets, they stop being paperwork and become a roadmap for better reliability.
Start small: make notes mandatory, clean up your codes and statuses, simplify dashboards, and use AI to surface patterns. Over time, these simple steps compound into faster repairs, fewer surprises, and a maintenance program that clearly proves its impact on production.


.webp)
.webp)