
If your facility had to be rebuilt from scratch tomorrow, how much would it cost to replace every piece of equipment you rely on?
That total cost is your replacement asset value (RAV).
Knowing that number puts maintenance expenditures into perspective. It shows how much of your budget goes toward preserving asset performance compared to what it would cost to replace those assets entirely.
This context helps justify capital investments, guides replacement planning, and gives leadership confidence in resource allocation.
When tracked consistently, RAV builds a stronger foundation for audits, insurance assessments, and long-term planning. It connects maintenance work like repairs, inspections, and parts orders to the overall financial health of the organization.
In this guide, you’ll learn how to calculate RAV, where to find reliable cost data, and how to use those insights to improve budgeting, asset management, and maintenance strategy.
Key takeaways
- Replacement asset value (RAV) shows what it would cost to replace your facility’s assets at today’s prices.
- Tracking RAV helps you connect maintenance spending to asset value to give you a better view into how efficiently your team protects the equipment that drives your business.
- Maintenance cost to RAV (MC/RAV) is most useful for tracking trends within your own facility over time.
- Both high and low MC/RAV ratios can signal opportunity or risk, depending on context.
- Accurate, updated RAV data shows audit-readiness, ensures sufficient insurance coverage, and helps with budgeting.


What is replacement asset value (RAV)?
Replacement asset value is the estimated cost to replace an organization’s existing assets with new ones of equal function and capacity. The calculation is based on current market prices, so it’s not the same as book value or resale value. RAV includes the full cost of purchasing and installing new equipment, including the freight and taxes.
Maintenance teams use RAV as a baseline for maintenance performance metrics like maintenance cost to replacement asset value (MC/RAV). This ratio helps you see whether maintenance spending is proportional to the value of the assets being maintained.
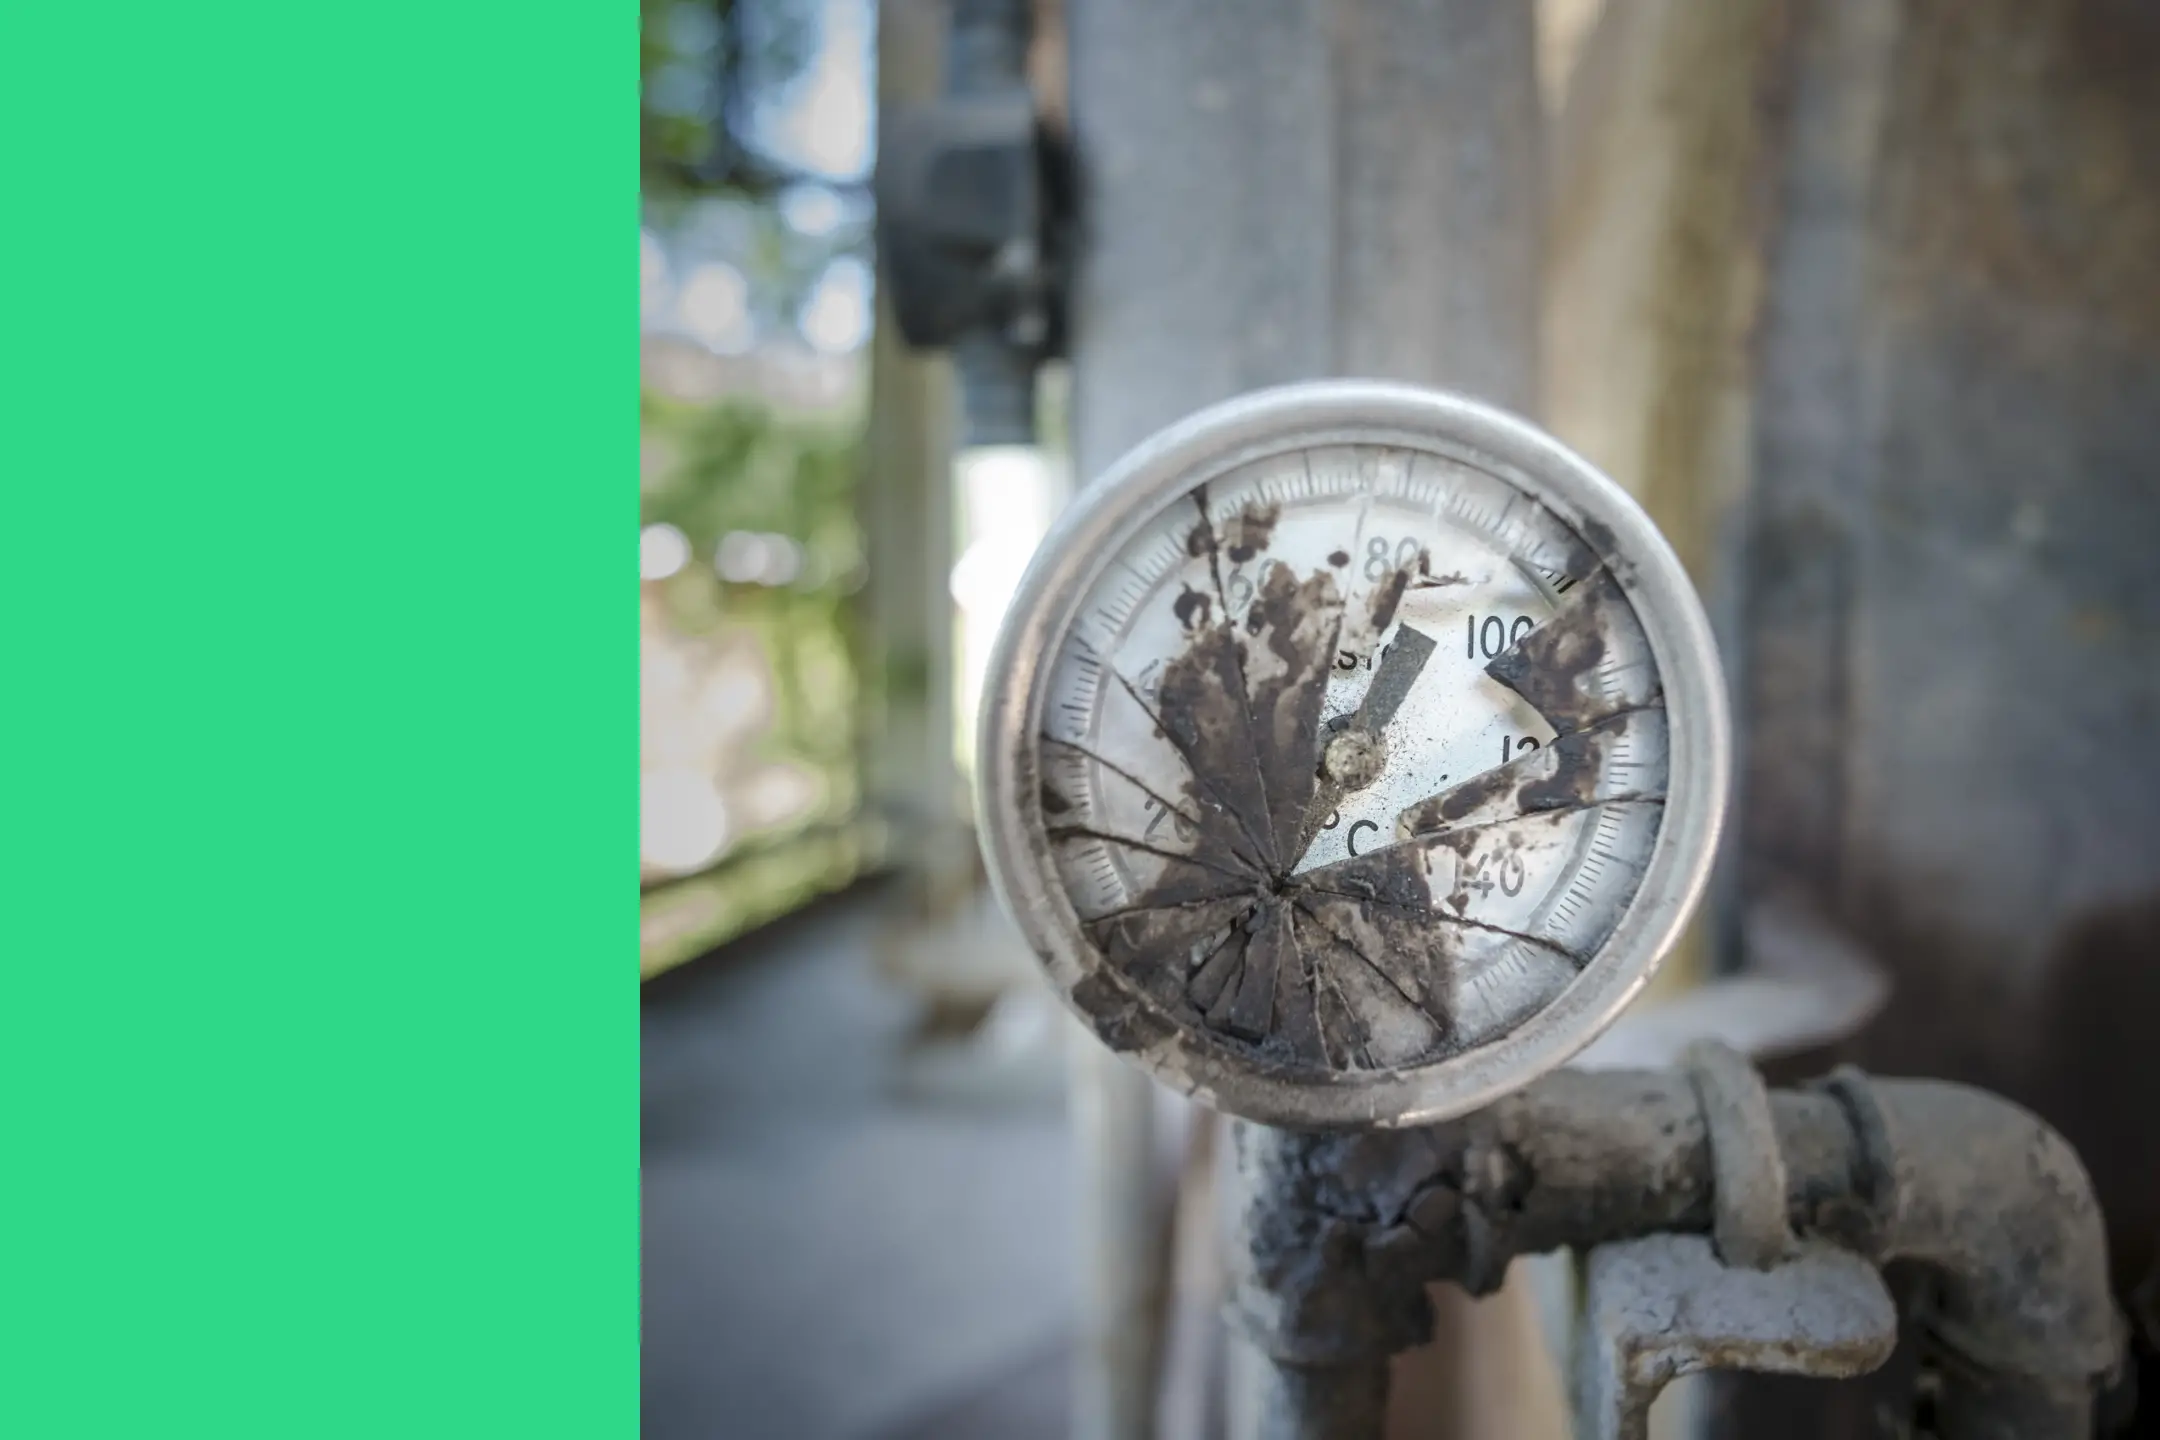
A high MC/RAV can signal inefficiency, deferred maintenance, or aging equipment that’s nearing the end of its useful life.
RAV also creates a consistent standard for insurance coverage, audits, and capital planning. It gives decision-makers confidence that maintenance budgets are in line with the value and importance of the assets.
How to calculate RAV
To calculate replacement asset value, start with your full asset list. You can pull this from your CMMS or enterprise asset management system.
Then, consult with equipment vendors to get quotes on what it would cost to purchase, ship, install, and train staff on new assets capable of performing the same tasks as your current inventory.
Where to get U.S. data sources for RAVs
The most reliable source for accurate replacement asset value estimates is to go straight to your suppliers and contractors for quotes.
If, for some reason, you can’t get quotes for every asset in your inventory, you can often turn to industry publications for some insight into current market prices for your equipment.
Another option is to look back at your internal accounting records for the original cost of your equipment. You can then adjust that cost based on inflation to arrive at a ballpark estimate for replacement asset value.
Be sure to use the same method each year, so you can compare results over time.
Calculating your MC/RAV
Once you know your total replacement asset value, compare it to your annual maintenance cost to measure maintenance efficiency.
The formula looks like this:
- MC/RAV = (Total annual maintenance cost / Total replacement asset value) × 100
This percentage shows how much you’re spending on your maintenance program relative to the total value of your assets.
How does tracking RAV benefit maintenance teams?
Replacement asset value offers a high-level view of how maintenance spending contributes to asset health and long-term value. It enables more accurate budgeting, smarter repair-versus-replace decisions, and measurable cost savings through better resource allocation.
Here’s how:
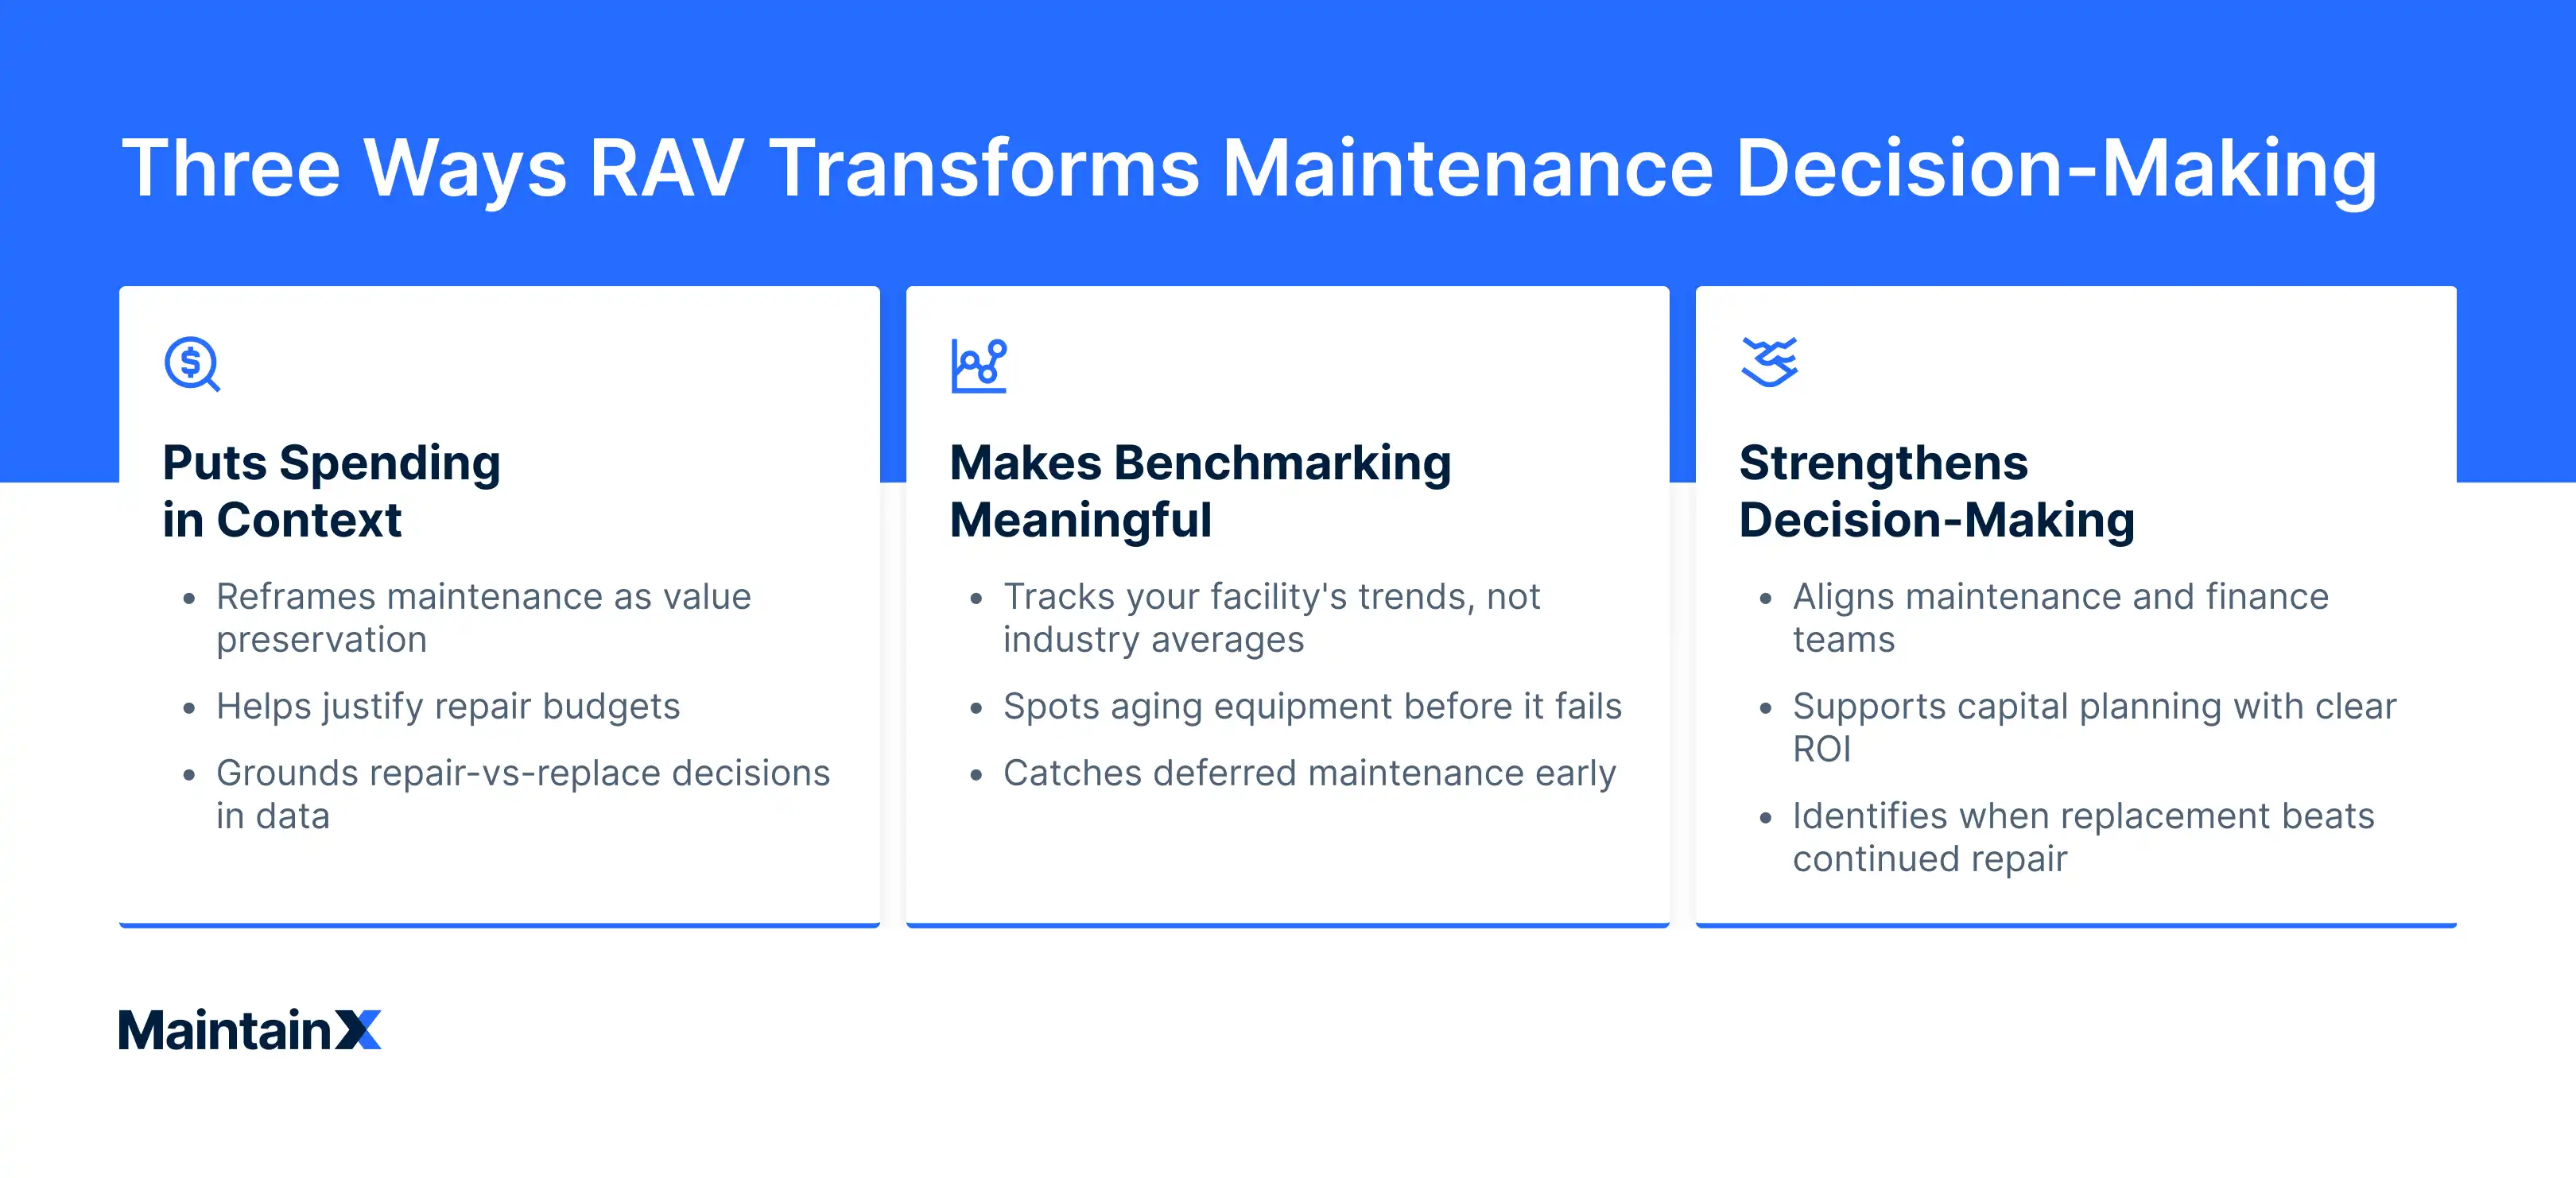
It puts maintenance spending in context
Tracking RAV helps teams see maintenance costs relative to the total value of their assets. It reframes the conversation from “Are we spending too much on maintenance?” to a more nuanced “Are we spending the right amount on maintenance based on the value of the asset we’re protecting?”
This change in perspective helps maintenance leaders defend budgets and identify outlier assets across multiple job sites. It also makes it easier to ground repair-versus-replace decisions in data.
As a result, RAV data gives executives confidence that maintenance investments are aligned with the company’s risk management and production goals.
It makes benchmarking meaningful
It’s tempting to compare your MC/RAV ratio to the commonly cited 2-3% benchmark, but experts warn against treating that figure as universal. Maintenance costs vary widely depending on your industry, equipment type, and operating environment.
A food processor, a mining operation, and an aircraft manufacturer will never share the same ratio; they shouldn’t. Wear rates, reliability requirements, regulatory inspections, fabrication standards, and training costs to use the equipment all vary dramatically, and, therefore, so do the benchmarks for each industry.
“The target number … is often applied to all industry with the assumption that all industry maintenance cost should be the same … this isn't a reasonable assumption,” says Tor Idhammar, owner of maintenance and reliability consulting firm IDCON. “A computer chip maker may buy a piece of equipment for $5 million to produce wafers, while a cement operation buys three 400-ton-load-capacity trucks for the same cost and same [RAV]. Does that mean the maintenance cost is the same for the wafer-making machine and the trucks? I doubt it, but that's the underlying assumption for use of the number.”
The real value of MC/RAV comes from tracking it over time within your own plant. For example, a rising ratio might reflect aging assets or reactive maintenance. A decline could signal successful preventive maintenance work, or reveal deferred maintenance that’s just saving money in the short term while creating future risks to operations.
“The current state of the assets must also be considered,” explains Ron Moore, managing partner of the RM Group. “For example, management may have decided to ‘milk’ the assets over previous years, driving maintenance costs down and, therefore, the ratio down, making it appear that an excellent job is being done.”
It strengthens decision-making across the organization
RAV data puts maintenance and finance teams on the same page. When leadership sees maintenance spending as a percentage of asset value, they understand maintenance as a value-preserving function, not a cost center.
Drawing that connection helps justify budget requests, support capital planning, and identify when it’s more cost-effective to replace than repair.
How to make your RAV audit- and insurance-ready
Beyond budgeting, an accurate, comprehensive, up-to-date replacement asset valuation ensures you are adequately covered by your insurance and gives auditors confidence in your books.
To make your RAV audit- and insurance-ready, make sure your data sources are transparent. Every number you use to calculate the market rate for your assets should trace back to a vendor quote, industry-standard index, or an internal estimate validated in some way against real-world prices.
Keeping RAV data current is important. Inflation, equipment upgrades, and supply chain snarls can all change replacement costs faster than many organizations realize. Update your RAV data annually in addition to when major assets are added, retired, or upgraded.
Turn RAV insights into a smart maintenance strategy
Replacement asset value serves as a foundation from which you can make maintenance decisions with business outcomes in mind.
RAV helps you identify where your maintenance dollars will create the most value for the company. It highlights which assets deserve reinvestment, where reliability risks are growing, and when the cost of upkeep starts to outweigh the cost of replacement.
The most effective teams use RAV trends to guide long-term maintenance planning.
To build on these insights, pair your RAV analysis with a proactive maintenance plan that balances cost, reliability, and uptime. Learn how in our guide to implementing smart and preventive maintenance strategies.
FAQs
How often should we update our replacement asset values, and what triggers an out-of-cycle update (e.g., inflation spikes, major upgrades)?
Most teams update RAV annually alongside insurance and audit cycles.
However, significant changes like major equipment upgrades, expansions, or inflation spikes can justify an out-of-cycle update.
The goal is to keep your RAV aligned with current market conditions so it remains accurate for budgeting purposes and insurance coverage.
What are the best practices to estimate RAV for rapidly depreciating technology where models change frequently and parts become obsolete?
For assets that depreciate rapidly or become obsolete fast—think specialized electronics—use current OEM list prices or apply inflation rates to your recent purchase data.
What is an example of replacement value?
If a facility’s packaging line, HVAC system, and compressors cost $12 million to purchase, ship, install, and train employees on, that figure represents the operation’s total RAV.
What’s the difference between maintenance cost and replacement asset value (RAV)?
Maintenance cost is what you spend on labor and material costs each year to keep assets operational.
Replacement asset value is what it would cost to replace those assets completely with new equipment that provides the same functionality.
Comparing the two through MC/RAV shows how maintenance spending relates to the total value of the asset you’re protecting.

The MaintainX team is made up of maintenance and manufacturing experts. They’re here to share industry knowledge, explain product features, and help workers get more done with MaintainX!


.webp)