Just like the car you drove to work, all the equipment at your job site loses value over time. Depreciation affects the company’s balance sheet. It also shapes how you justify and budget for capital to replace aging equipment.
Depreciation data helps reveal when a machine is costing more to maintain than it’s worth. That helps you decide when to repair vs. when to replace.
In this guide, we’ll break down the fundamentals of equipment depreciation, explain how to calculate it, and show how modern maintenance platforms help you connect financial data with equipment performance to inform repair-or-replace decisions.
You’ll learn to use accurate depreciation tracking to strengthen your maintenance strategy, reduce unplanned costs, and improve your bottom line.
Key takeaways
- Depreciation data drives better business outcomes by helping teams forecast replacements, compare maintenance costs to asset values, and plan capital budgets.
- Common calculation methods include straight-line, declining balance, sum-of-the-years’-digits, units-of-production, and component depreciation.
- Under IFRS, component depreciation is required. Under GAAP, it’s optional, but it helps improve accuracy for asset-heavy organizations.
- Tracking depreciation in a CMMS links accounting and maintenance data.
What is equipment depreciation and why does it matter?
Equipment depreciation, also known as asset depreciation, is the gradual loss of value an asset experiences as it ages, wears down, and becomes less efficient. From an accounting perspective, it’s how companies spread the entire cost of an asset over its useful life.
Depreciation appears on your company’s income statement as an expense. On the balance sheet, you record the asset’s reduced value. Your finance team is typically responsible for calculating depreciation and reporting it to the IRS.
Equipment depreciation affects profit and tax liability. The higher the depreciation expense, the lower your taxable income.
Finance and maintenance teams should work together to determine the appropriate path forward for equipment approaching its end of life. Equipment depreciation data will determine whether capital or maintenance makes the most sense going forward.
How to calculate equipment depreciation
There’s no one-size-fits-all way to calculate equipment depreciation. The right method depends on how your organization uses its assets, how quickly they lose value, and what your financial strategy is.
Below are five common depreciation methods used in manufacturing and industrial settings.
Straight-line (SL)
The straight-line method spreads an asset’s cost evenly across its useful life. It assumes the equipment provides equal value every year.
This is the most common method for maintenance-heavy industries where equipment operates consistently from year to year. Many operators prefer this method because it provides predictability, and it is easy to track in your accounting and maintenance systems.
The formula looks like this:
- [Depreciation Expense] = ([Cost of Asset] − [Salvage Value]) / [Useful Life (years)]
If a company buys a $100,000 packaging line with an estimated useful life of 10 years and a $10,000 salvage value at the end of its equipment life, then:
- (100,000 − 10,000) / 10 = 9,000 per year
So, the company records $9,000 in asset depreciation expense annually until the machine reaches its salvage value.
Declining balance (DB) / Double-declining balance (DDB)
The declining balance method accelerates depreciation. In other words, it assigns higher expenses in the early years and lower ones later.
This is best for equipment that loses value or efficiency quickly, like electronics or high-use machinery. It reflects the fact that many assets deliver the most value when they’re new.
The formula looks like this:
- [Depreciation Expense] = 2 x [Straight-Line Rate] x [Book Value at Beginning of Year]
Let’s take that same $100,000 packaging line. Under the straight-line method, you would deduct $9,000 every year for 10 years, or 10% of the value every year. Now, instead of deducting the same amount every year based on the asset’s initial value, you’re using a consistent rate, but applying it to the depreciated rate. That means you get a smaller expense each year.
For example:
- Year 1 = 2 x .1 x $100,000 = $20,000 depreciation expense
- Year 2 = 2 x .1 x $80,000 = $16,000 depreciation expense
- Year 3 = 2 x .1 x $64,000 = $12,800 depreciation expense
You’d carry that on until you reached the salvage value.
Sum-of-the-years’-digits (SYD)
The sum-of-the-years’-digits method also accelerates depreciation, but it uses a weighted system to calculate how much value is lost each year.
This is useful when an asset’s productivity drops steadily rather than sharply. It’s a little more precise than the declining balance method, so it’s a good fit for equipment that wears gradually.
The formula looks like this:
- [Depreciation Expense] = ([Remaining Lifespan / [Sum of the Years’ Digits]) x ([Cost] − [Salvage Value])
To find the sum-of-the-years’-digits, you add each year of the asset’s useful life together. For a 10-year asset like our packaging line, you’d add 1 + 2 + 3 + … + 10 = 55
Calculating the depreciation of our example packaging line with the SYD method looks like this:
- Year 1 = (10 / 55) x ($100,000 − $10,000) = $16,364 depreciation expense
- Year 2 = (9 / 55) x ($100,000 − $10,000) = $14,727 depreciation expense
- Year 3 = (8 / 55) x ($100,000 − $10,000) = $13,091 depreciation expense
Again, you’d carry that on until you reached the salvage value.
Units-of-production (UoP)
Instead of assuming a steady decline each year, the units-of-production method ties depreciation directly to production efficiency, hours run, or another metric that measures usage.
This is ideal for equipment where use varies from year to year. In high-production years, depreciation, and therefore expense, rises. As production slows, expense falls.
The formula looks like this:
- [Depreciation Expense] = (([Original Cost] − [Salvage Value]} x [Units Produced in a Year]) / [Total Estimated Units Over Life]
Let’s say, then, that our $100,000 packaging line is expected to produce 1 million packages before it reaches salvage value. Perhaps it produces 150,000 packages in the first year.
That would look like this:
- (($100,000 − $90,000) x 150,000) / 1,000,000 = $13,500 in depreciation expense
The book value of your packaging line is now $86,500.
The next year, you would change the “units produced in a year” figure to match production, and run the calculation again to get that year’s depreciation expenses.
Then, you’d subtract that from the book value. This continues until you reach the equipment’s salvage value.
Component depreciation
Component depreciation breaks down complex assets into discrete parts and depreciates each one separately. This method recognizes that not every component of a machine wears out at the same rate or costs the same to replace.
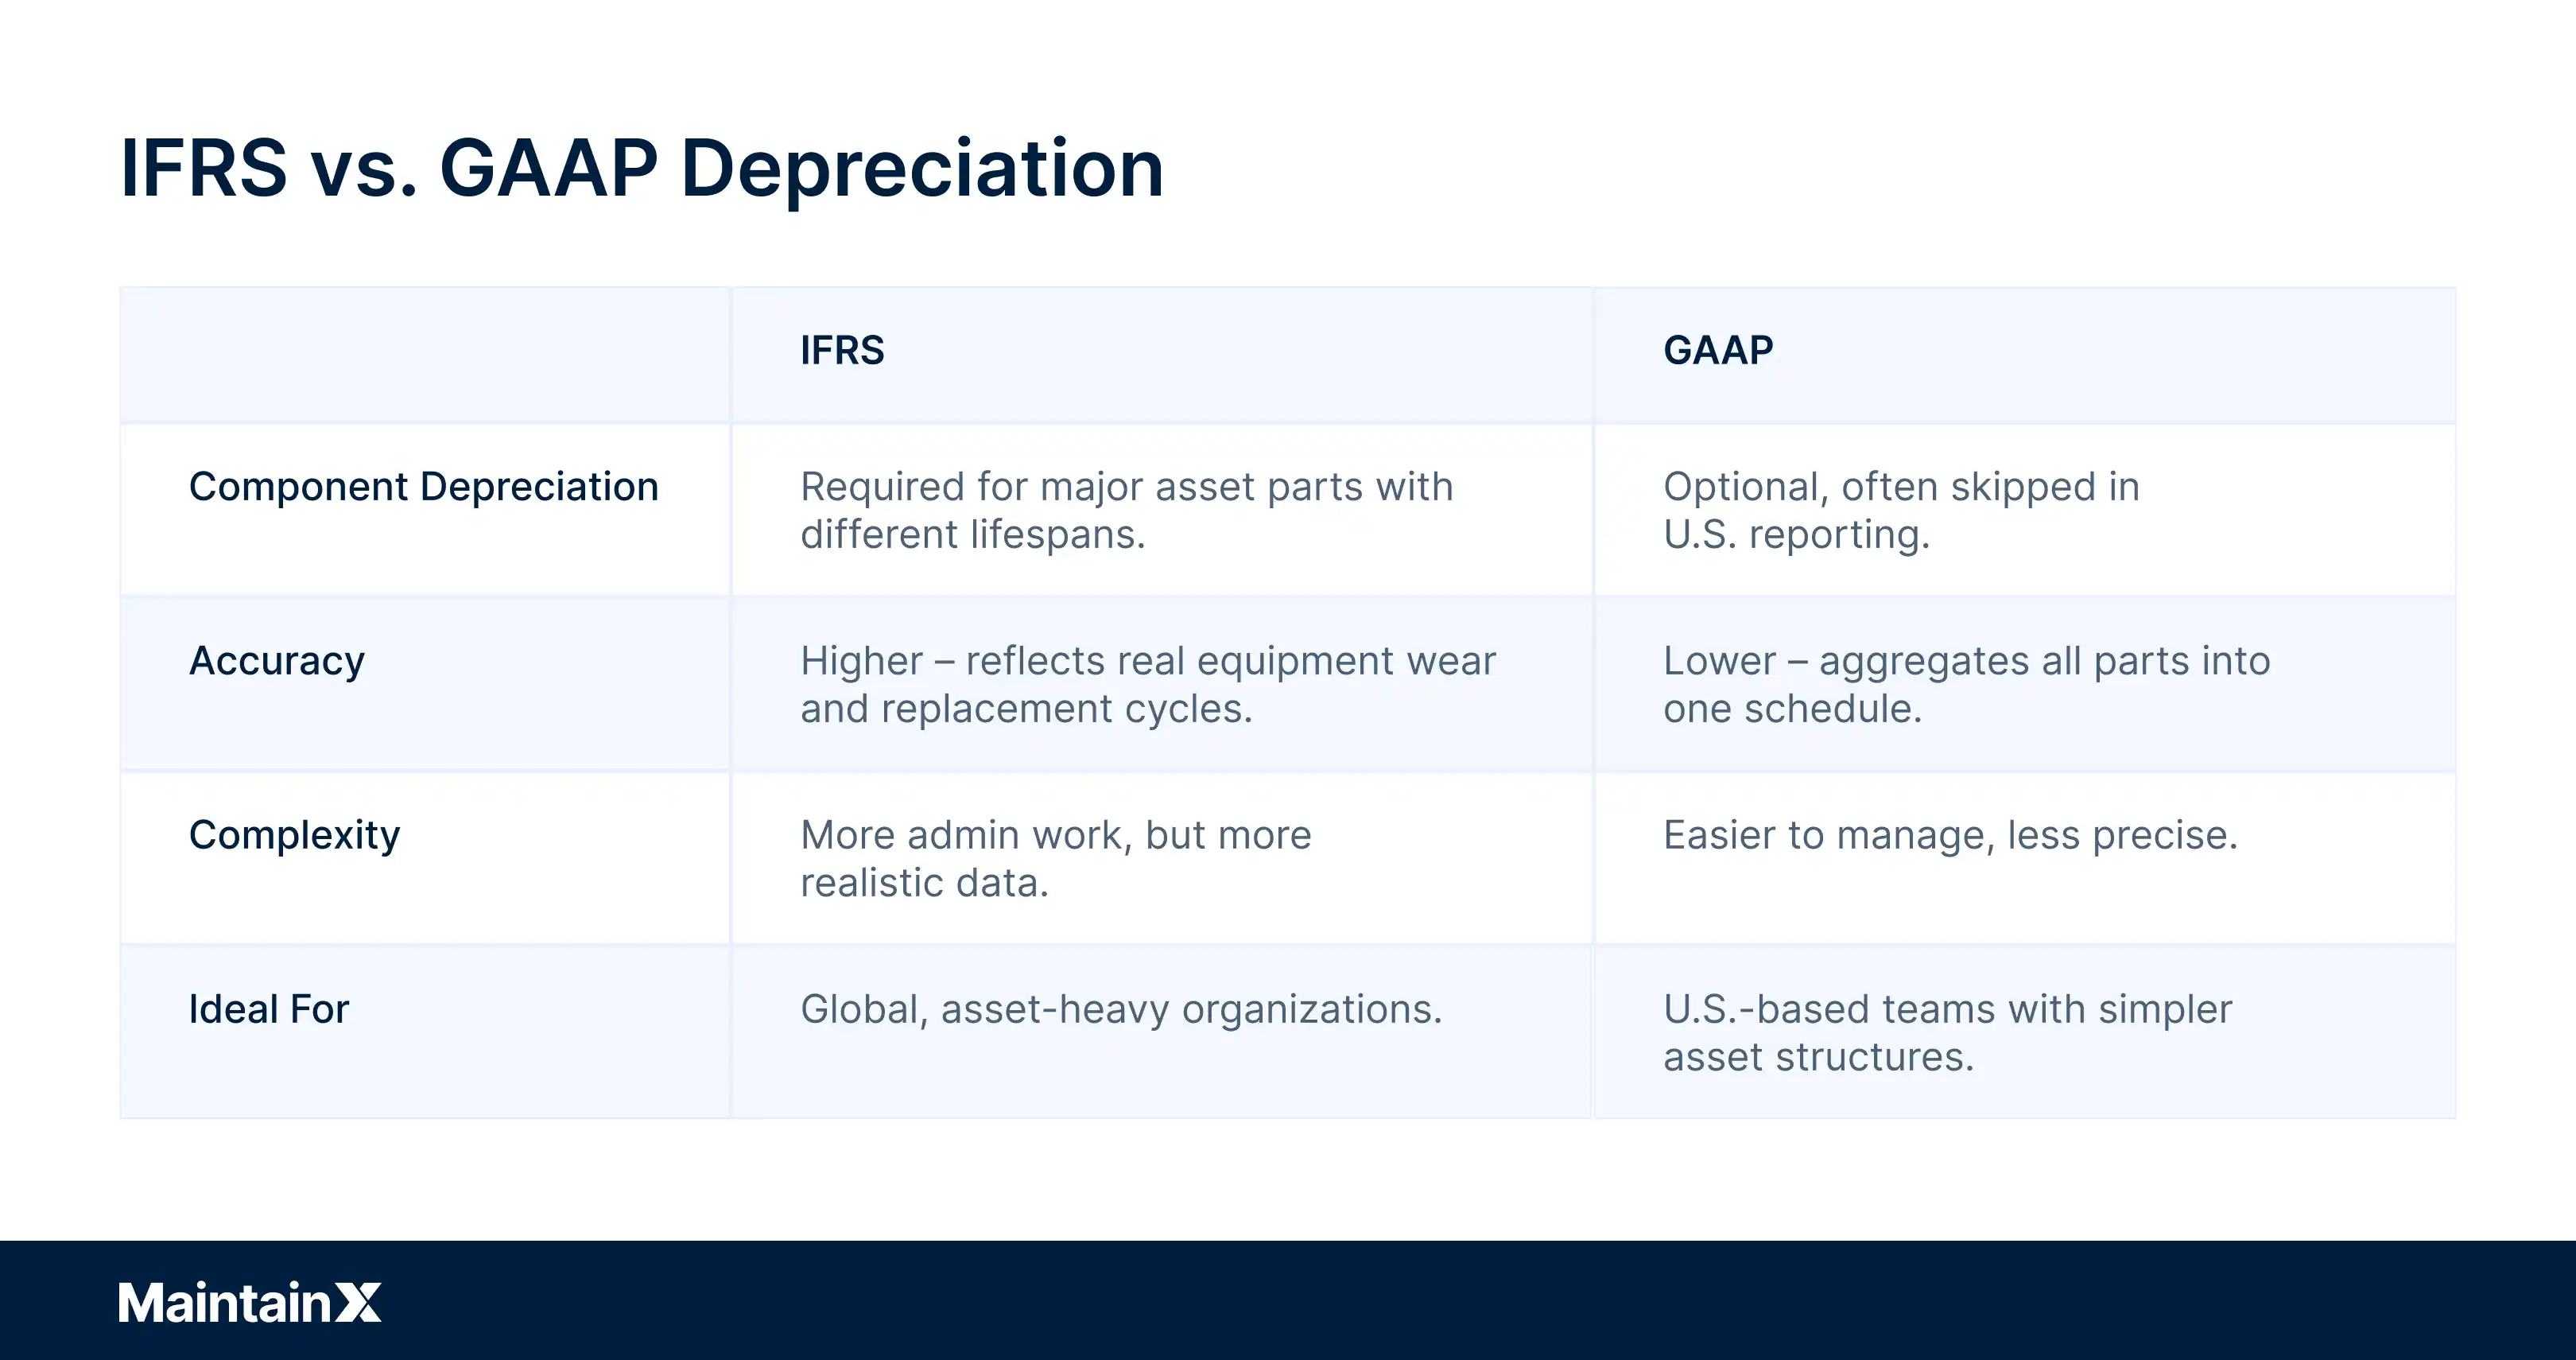
This method is especially useful for facilities that operate under IFRS accounting standards, where you must separate asset components when their useful lives differ significantly.
It’s also valuable for operations leaders who want better long-term budget forecasting, since it aligns financial depreciation with actual maintenance and replacement cycles.
The formula looks like this:
- Depreciation Expense for the Component = ([Component Cost] − [Component Salvage]) / [Component Useful Life in Years]
Our $100,000 packaging line comprises a:
- Conveyor system: $60,000 cost, 8-year life, $6,000 salvage value
- Control panel and electronics: $30,000 cost, 5-year life, $3,000 salvage value
- Frame and housing: $10,000 cost, 20-year life, $1,000 salvage value
Instead of treating the packaging line as a single 10-year fixed asset, this approach recognizes that each part ages differently. For example, the electronics will need to be replaced long before the frame does. Using straight-line depreciation for each component, you get:
- Conveyor system: (60,000 − 6,000) / 8 = 6,750
- Control panel and electronics: (30,000 − 3,000) / 5 = 5,400
- Frame and housing: (10,000 − 1,000) / 20 = 450
Add those totals together and first-year depreciation is $12,600.

Component depreciation under IFRS and U.S. GAAP
Financial reporting rules determine how and when your organization records depreciation. Both the International Financial Reporting Standards (IFRS) and Generally Accepted Accounting Principles (GAAP) aim to reflect an asset’s real economic value over time. But they approach component depreciation differently.
IFRS requires component depreciation
Under IFRS, companies must separate significant parts of an asset that have different useful lives or replacement cycles. Each major component is treated as its own asset for depreciation purposes.
For example, to satisfy IFRS, we would need to track the control panel and electronics, conveyor system, and the frame and housing of our packaging line separately.
The control system likely needs to be replaced first. When you replace it, you write off, or remove it from your accounting records, because it’s no longer in use.
The cost of the new control system is then capitalized, which means you add it to your balance sheet as a new asset and start it on its own depreciation schedule.
All of this accounting work makes sure your financial data reflects what’s actually running on the factory floor.
How modern CMMS platforms track equipment depreciation
In many organizations, equipment depreciation is handled in back office accounting software, far removed from the daily maintenance activity that drives an asset’s true performance on the factory floor.
Traditionally, organizations have calculated depreciation by writing complex macros in a spreadsheet and pulling equipment performance data manually.
A modern computerized maintenance management system (CMMS) does that part automatically. That way, it seamlessly bridges the gap between what happens on the shop floor and what gets reported in the office.
When maintenance and finance teams use an integrated system to track asset data, they gain visibility into how performance affects cost, replacement timing, and overall business outcomes.
Here’s how that works in practice:
Input asset data
First, you enter information into the CMMS about your asset, like purchase price, salvage value, useful life, and the date you placed the equipment in service.
That data becomes the foundation for automatic depreciation calculations and ensures finance and maintenance teams are referencing the same baseline.
Choose a depreciation method
A good CMMS will support several calculation methods so teams can match financial schedules to how the equipment is used.
This is where you would select straight-line, declining balance, or any of the other deduction methods we discussed, depending on the equipment and how you expect its performance to deteriorate over time. You can also create subassets to comply with IFRS and GAAP accounting standards.
The CMMS tracks depreciation and provides insights
Once the data and depreciation method are set, a CMMS automatically calculates depreciation, which eliminates manual tracking in spreadsheets and reduces reporting errors.
More importantly, a CMMS can combine that depreciation data with maintenance records and performance metrics to help maintenance teams predict when an asset will need to be replaced and evaluate when a repair expense outweighs an asset’s remaining value.
It also generates reports that align with accounting and tax standards, so you can prove compliance during audits and other regulatory reviews.
Turn maintenance insights into smarter equipment depreciation
Every maintenance task affects the rate at which equipment loses value. When records of those tasks live alongside depreciation tracking inside your CMMS, you can see exactly how your maintenance strategies influence an asset’s value.
By connecting asset performance with financial data, a CMMS like MaintainX helps your team:
- Identify the true cost of ownership of every machine
- Plan repairs, replacements, and capital investments proactively
- Reduce downtime and extend asset life through smarter maintenance
To take the next step in optimizing your asset lifecycle, read our companion guide: How to Determine the Useful Life of an Asset.
FAQs
Is equipment classified as a 5-year or 7-year depreciation asset?
The IRS Publication 946 is the ultimate authority on what is classified as a 5-year or 7-year depreciation asset.
Generally, 5-year assets are things like automobiles, technological equipment like computers, and machinery equipment.
By contrast, 7-year assets are things like office furniture, and property that does not have a specified depreciation life by law.
What is an example of depreciation on equipment?
Suppose your company buys a $100,000 packaging line with a 10-year useful life and a $10,000 salvage value.
Using the straight-line method, the annual depreciation would be:
($100,000 − $10,000) / 10 = $9,000
Each year, your accounting team records $9,000 as a depreciation expense until the asset’s book value reaches $10,000. This steady approach helps spread the asset’s cost evenly across its life and aligns expenses with production value.
What is the depreciation rate for equipment?
The depreciation rate depends on the method and useful life you choose. For the straight-line method, the rate is simply:
1 / useful life (in years)
So, an asset with a 10-year life depreciates at 10% per year.
For accelerated methods, such as double-declining balance, the rate doubles (for example, 20% per year for a 10-year asset).
Your accounting team selects the rate based on the asset’s expected wear, maintenance costs, and industry standards.


.webp)