REPORTING
Turn data into cost-saving insights


Our clients using MaintainX report
Create reports with natural language
Ask questions. Get insights. MaintainX AI makes reporting and data analysis effortless with natural language queries.
Describe what you want to measure, and MaintainX AI will find the data, generate charts, and uncover insights—no data science degree required.
Improve performance against KPIs and goals
Track your resources and optimize operations to hit your most important goals, like reducing MTTR, increasing production capacity, and reducing downtime.

Transition from reactive to preventive maintenance
Track the health of your PM program and quickly spot broken maintenance processes before they hurt your bottom line.

Enforce safety and compliance with detailed audit trails
Simplify your compliance with regulatory bodies like OSHA with real-time records of work order history and maintenance activity.

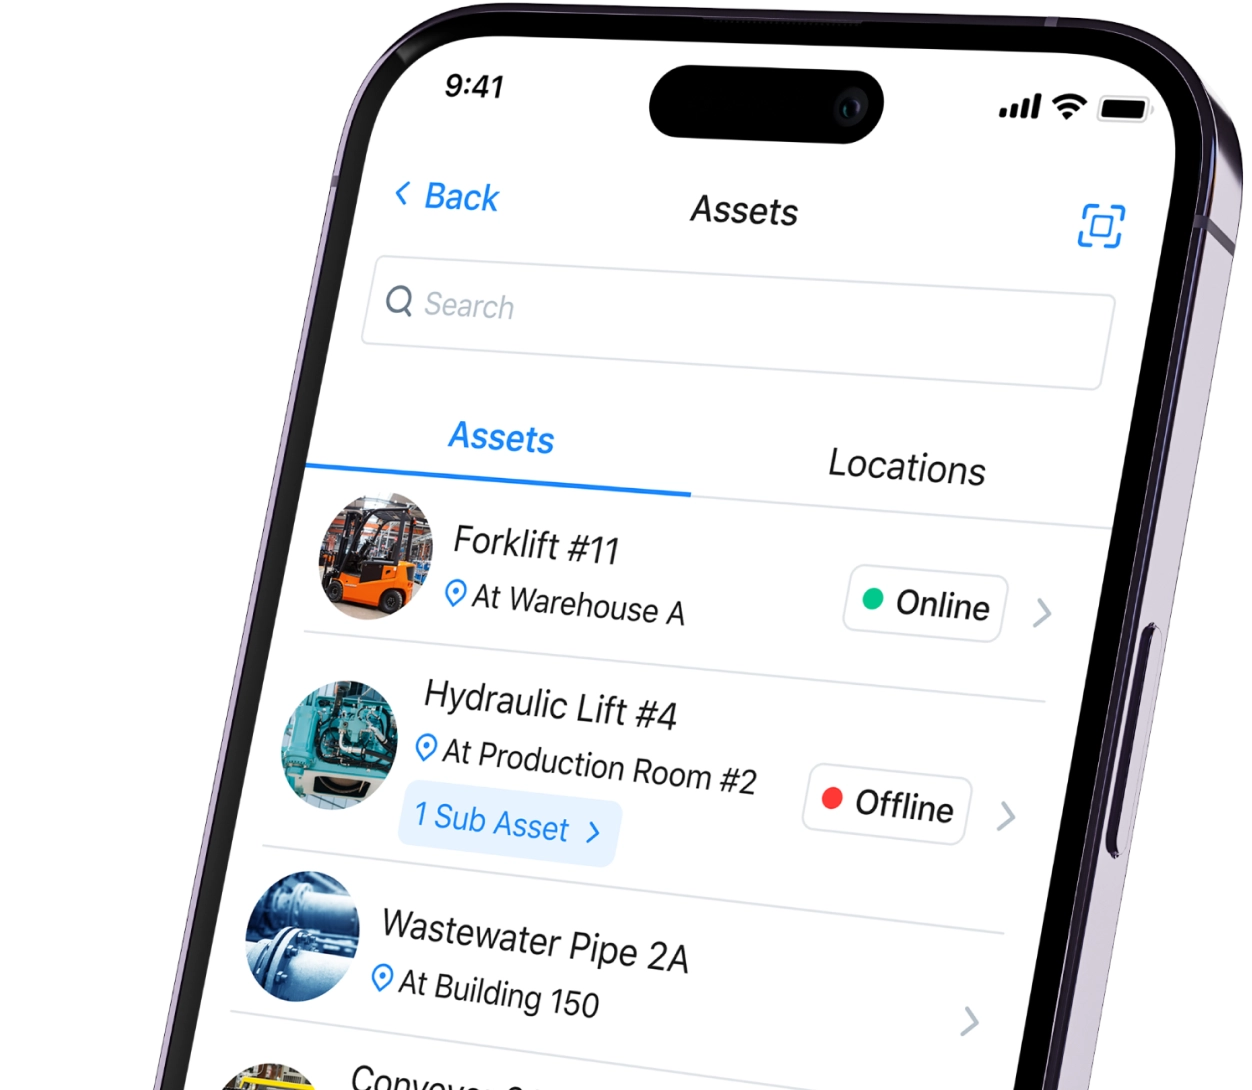
Track asset health and identify problematic assets
Minimize downtime and safeguard revenue with proactive alerts before an asset fails, insights that tell you why assets fail, and which assets are costing you the most.

Get the right insights with filters and custom dashboards
Tailor your insights to fit your needs, whether it’s by comparing performance across sites, building custom dashboards, or filtering reports by team, asset criticality, and so much more.

Save time with scheduled reports and exports
Share the right data with stakeholders at the right time with scheduled reports, and export them in your desired formats like PDF or CSV.

Award-winning software you can trust
Not convinced?


See what customers have to say
Maintenance Reporting FAQs
What is maintenance reporting software, and how does it support maintenance management?
Maintenance reporting software is a type or component of maintenance management software that helps teams collect and analyze maintenance data from daily maintenance tasks. It allows teams to collect, organize, and analyze data on work orders, asset performance, and maintenance costs. It turns day-to-day maintenance activity into actionable maintenance reports that improve decision-making, reduce downtime, and optimize preventive maintenance programs. MaintainX empowers maintenance managers and maintenance personnel with real-time visibility into operations, helping them track maintenance KPIs, identify recurring issues, and streamline compliance reporting in a single platform.
How can a CMMS help generate accurate maintenance reports?
A CMMS (computerized maintenance management system) automates maintenance data collection from work orders, asset logs, maintenance requests, and other maintenance tasks to generate accurate, real-time maintenance reports. MaintainX’s CMMS eliminates manual data entry errors by tracking every maintenance activity in your maintenance management software. This ensures maintenance managers always have up-to-date records on maintenance history, labor hours, and asset reliability. Custom dashboards also allow maintenance teams to filter and segment data to see trends that matter to them. The result is more precise data for smarter decisions.
What types of key performance indicators (KPIs) should maintenance teams track using a CMMS?
Maintenance teams should use a CMMS to track KPIs such as mean time to repair (MTTR), mean time between failures (MTBF), planned maintenance percentage, preventive maintenance compliance, asset downtime, labor utilization, and maintenance costs. This allows teams to analyze the effectiveness of their preventive maintenance scheduling, response readiness, inventory management, and other aspects of their asset management program. MaintainX simplifies KPI tracking through built-in dashboards and customizable reports, giving managers instant visibility into performance metrics that drive operational efficiency and continuous improvement.
How does maintenance reporting software improve operational efficiency and reduce downtime?
Maintenance reporting software improves operational efficiency by identifying patterns that lead to equipment failures, unplanned downtime, and higher operational costs. MaintainX enables teams to move from reactive to preventive maintenance by providing real-time asset data, work order insights, and compliance tracking. These reports empower managers to effectively allocate resources to maintenance requests, optimize their preventive maintenance scheduling, increase asset reliability, and minimize costly production interruptions.
What are the benefits of using digital reports over manual tracking of maintenance work?
Digital maintenance reports eliminate the inefficiency and inaccuracy that is common with paper-based systems and spreadsheets. With MaintainX, data is automatically collected, centralized, and instantly accessible from any device. This improves accuracy, saves hours of manual tracking, and makes it easier to share insights across teams. Managers can generate scheduled reports, monitor KPIs, and make informed decisions without relying on outdated, manual processes.
How can maintenance reports help managers track labor hours and control maintenance costs?
Maintenance reports provide detailed visibility into labor utilization, overtime, and total maintenance costs. MaintainX automatically logs who performed maintenance work, how long tasks took, and which assets or parts were involved. This helps managers identify cost drivers, improve workforce planning, and reduce unnecessary spending with accurate, real-time data.
What role does maintenance reporting play in preventive maintenance scheduling and tracking?
Maintenance reporting plays a critical role in preventive maintenance by showing which tasks are completed on time, which assets frequently fail, and how effective your PM program is. MaintainX connects these insights directly to your maintenance schedule, helping teams fine-tune preventive measures, avoid reactive maintenance, and extend asset lifespans.
Can I customize maintenance reports to include maintenance logs, asset history, and work performed?
Yes. With maintenance software from MaintainX, users can build custom maintenance reports to analyze maintenance logs, work performed, asset history, labor hours, and costs. You can filter by site, team, or equipment type to get tailored insights that match your operational goals with just a few clicks.
How can maintenance reports help identify recurring maintenance issues or trends across locations?
MaintainX reporting highlights recurring equipment failures, parts issues, or process gaps across sites by making maintenance data visible on a single dashboard. These trend insights help organizations implement corrective actions faster, reduce downtime, and improve consistency across multi-site operations. With real-time dashboards, you can quickly see where problems occur and why right from your maintenance software.
What types of reports can be generated for asset tracking, inventory management, and maintenance activity?
MaintainX supports a wide range of report types, including asset performance, inventory usage, maintenance activity, labor tracking, and cost analysis. These reports provide a complete view of operations, from parts inventory levels to equipment reliability, which helps maintenance managers make informed, data-backed decisions.
How does accurate reporting help organizations optimize maintenance programs and control costs?
Accurate maintenance reporting helps organizations measure the success of their maintenance programs by linking real-time data to KPIs like downtime, cost per work order, and PM compliance. MaintainX ensures data accuracy through automated logging and user-friendly dashboards, enabling better forecasting, cost control, and strategic planning for maintenance operations.
Can CMMS reporting tools support facility managers in creating audit-ready performance reports?
Absolutely. MaintainX’s CMMS reporting tools automatically capture maintenance records, asset histories, and inspection logs to ensure facility managers can easily generate audit-ready reports. These detailed records, available in a few clicks from your maintenance software, allow you to simplify regulatory compliance with bodies like OSHA and ISO, providing transparent documentation of all maintenance work performed.
Get more done with MaintainX


